Plot paired data.
Usage
ggpaired(
  data,
  cond1,
  cond2,
  x = NULL,
  y = NULL,
  id = NULL,
  color = "black",
  fill = "white",
  palette = NULL,
  width = 0.5,
  point.size = 1.2,
  line.size = 0.5,
  line.color = "black",
  linetype = "solid",
  title = NULL,
  xlab = "Condition",
  ylab = "Value",
  facet.by = NULL,
  panel.labs = NULL,
  short.panel.labs = TRUE,
  label = NULL,
  font.label = list(size = 11, color = "black"),
  label.select = NULL,
  repel = FALSE,
  label.rectangle = FALSE,
  ggtheme = theme_pubr(),
  jitter = 0,
  ...
)
Arguments
- data
a data frame
- cond1
variable name corresponding to the first condition.
- cond2
variable name corresponding to the second condition.
- x, y
x and y variables, where x is a grouping variable and y contains values for each group. Considered only when
cond1andcond2are missing.- id
variable name corresponding to paired samples' id. Used to connect paired points with lines.
- color
points and box plot colors. To color by conditions, use color = "condition".
- fill
box plot fill color. To change fill color by conditions, use fill = "condition".
- palette
the color palette to be used for coloring or filling by groups. Allowed values include "grey" for grey color palettes; brewer palettes e.g. "RdBu", "Blues", ...; or custom color palette e.g. c("blue", "red"); and scientific journal palettes from ggsci R package, e.g.: "npg", "aaas", "lancet", "jco", "ucscgb", "uchicago", "simpsons" and "rickandmorty".
- width
box plot width.
- point.size, line.size
point and line size, respectively.
- line.color
line color.
- linetype
line type.
- title
plot main title.
- xlab
character vector specifying x axis labels. Use xlab = FALSE to hide xlab.
- ylab
character vector specifying y axis labels. Use ylab = FALSE to hide ylab.
- facet.by
character vector, of length 1 or 2, specifying grouping variables for faceting the plot into multiple panels. Should be in the data.
- panel.labs
a list of one or two character vectors to modify facet panel labels. For example, panel.labs = list(sex = c("Male", "Female")) specifies the labels for the "sex" variable. For two grouping variables, you can use for example panel.labs = list(sex = c("Male", "Female"), rx = c("Obs", "Lev", "Lev2") ).
- short.panel.labs
logical value. Default is TRUE. If TRUE, create short labels for panels by omitting variable names; in other words panels will be labelled only by variable grouping levels.
- label
the name of the column containing point labels. Can be also a character vector with length = nrow(data).
- font.label
a list which can contain the combination of the following elements: the size (e.g.: 14), the style (e.g.: "plain", "bold", "italic", "bold.italic") and the color (e.g.: "red") of labels. For example font.label = list(size = 14, face = "bold", color ="red"). To specify only the size and the style, use font.label = list(size = 14, face = "plain").
- label.select
can be of two formats:
a character vector specifying some labels to show.
a list containing one or the combination of the following components:
top.upandtop.down: to display the labels of the top up/down points. For example,label.select = list(top.up = 10, top.down = 4).criteria: to filter, for example, by x and y variables values, use this:label.select = list(criteria = "`y` > 2 & `y` < 5 & `x` %in% c('A', 'B')").
- repel
a logical value, whether to use ggrepel to avoid overplotting text labels or not.
- label.rectangle
logical value. If TRUE, add rectangle underneath the text, making it easier to read.
- ggtheme
function, ggplot2 theme name. Default value is theme_pubr(). Set ggtheme = NULL to skip applying a ggpubr theme, so the plot keeps ggplot2 default theme or the theme set globally via theme_set(). Allowed values include ggplot2 official themes: theme_gray(), theme_bw(), theme_minimal(), theme_classic(), theme_void(), ....
- jitter
numeric value (default 0, no jitter) giving the amount of horizontal jitter added to the paired points to reduce overlap. Points are nudged sideways within
[-jitter, jitter]; each subject (id) gets a single offset so its two points move together and the connecting line stays intact. Only the horizontal positions change (the values are never moved). Typical values are small relative to the boxwidth(e.g.jitter = 0.05to0.1).jitter = 0leaves the plot unchanged.- ...
other arguments to be passed to be passed to ggpar().
Examples
# Example 1
# ::::::::::::::::::::::::::::::::::::::::::
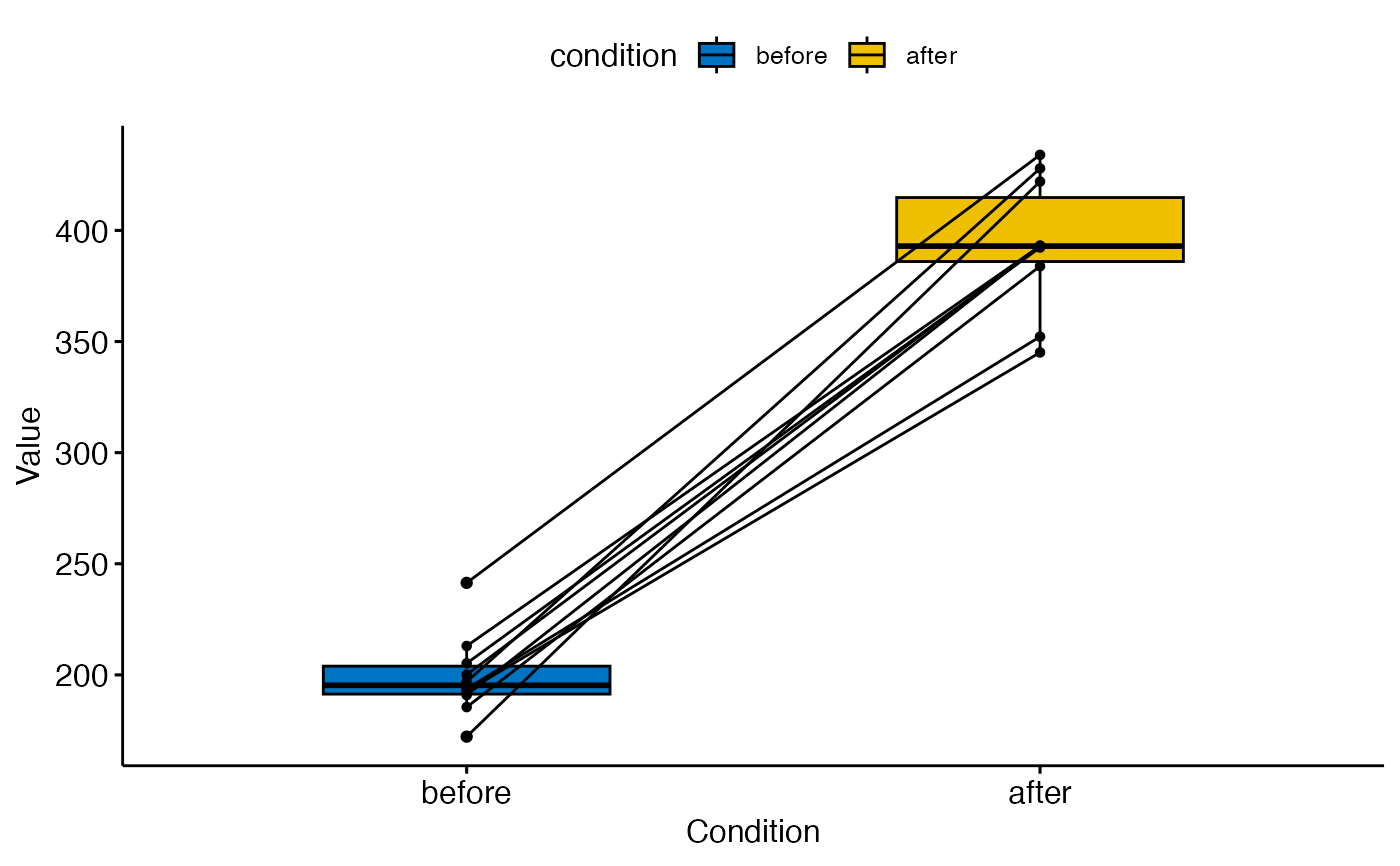
before <- c(200.1, 190.9, 192.7, 213, 241.4, 196.9, 172.2, 185.5, 205.2, 193.7)
after <- c(392.9, 393.2, 345.1, 393, 434, 427.9, 422, 383.9, 392.3, 352.2)
d <- data.frame(before = before, after = after)
ggpaired(d,
cond1 = "before", cond2 = "after",
fill = "condition", palette = "jco"
)
 # Example 2
# ::::::::::::::::::::::::::::::::::::::::::
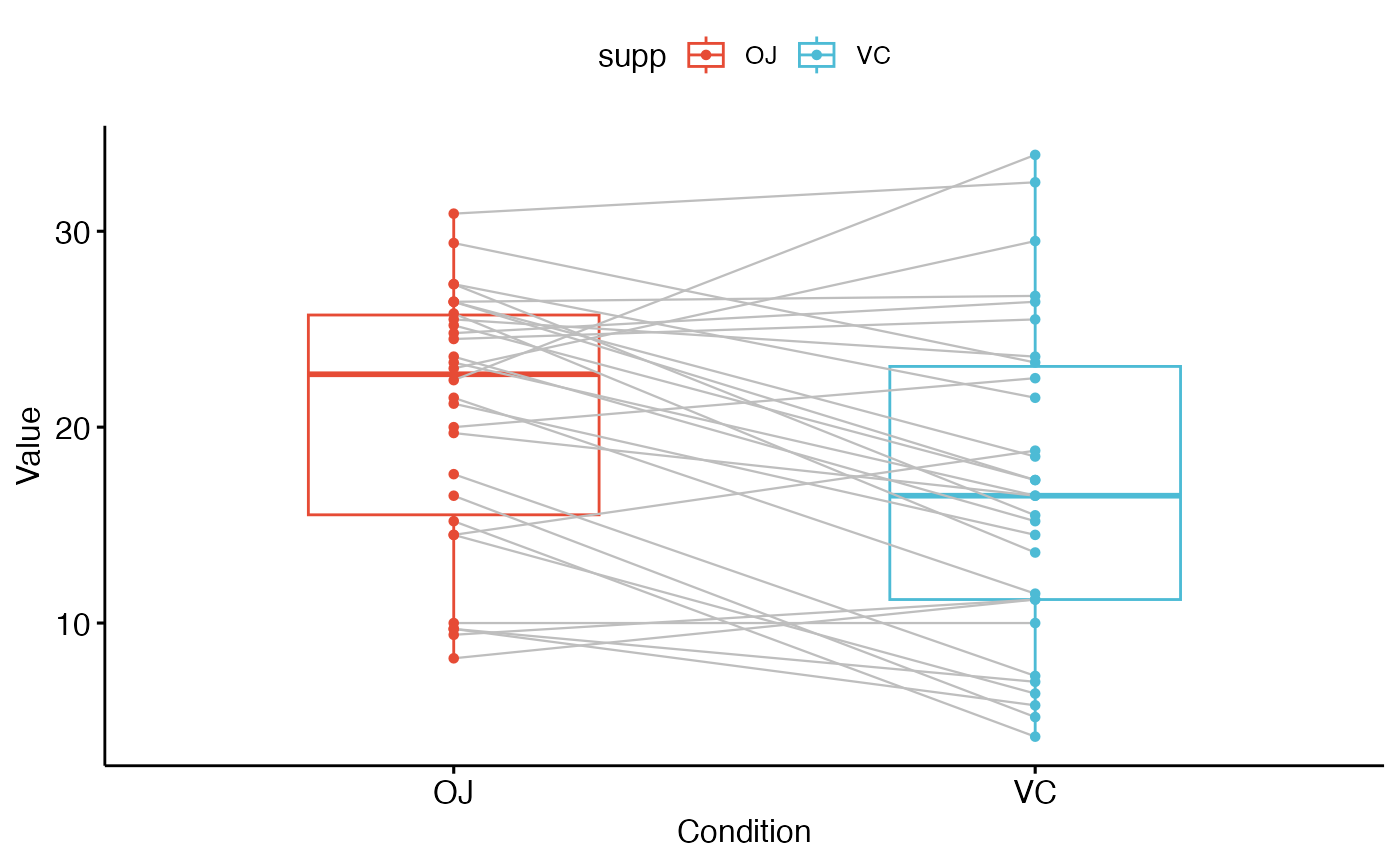
ggpaired(ToothGrowth,
x = "supp", y = "len",
color = "supp", line.color = "gray", line.size = 0.4,
palette = "npg"
)
# Example 2
# ::::::::::::::::::::::::::::::::::::::::::
ggpaired(ToothGrowth,
x = "supp", y = "len",
color = "supp", line.color = "gray", line.size = 0.4,
palette = "npg"
)