Playing with fonts and texts
Marcin Kosinski
Source:vignettes/Playing_with_fonts_and_texts.Rmd
Playing_with_fonts_and_texts.Rmdlibrary("survminer")
This vignette covers changes between versions 0.2.4 and 0.2.5 for additional texts and fonts customization enabled for subtitles and captions.
Survival plot
Basic
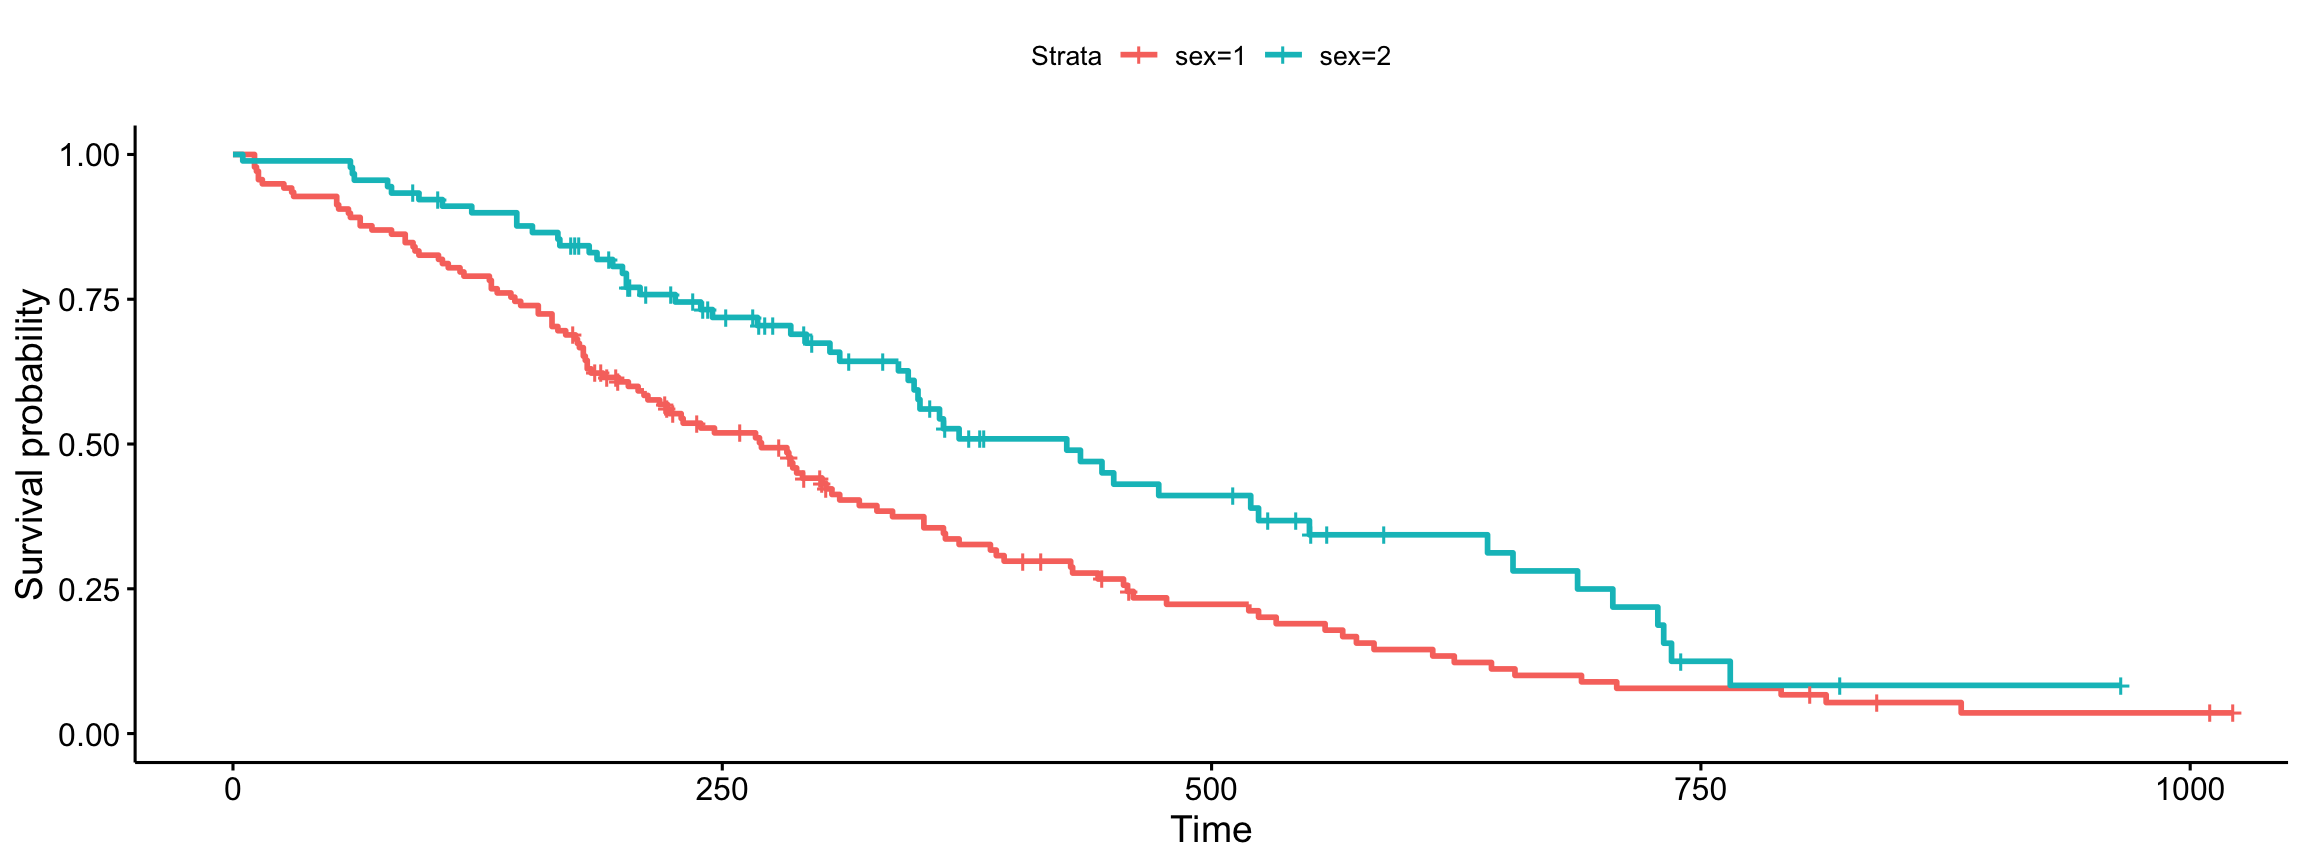
Compare the basic plot
library("survival")
fit<- survfit(Surv(time, status) ~ sex, data = lung)

# Drawing survival curves
ggsurvplot(fit, data = lung)
Customized
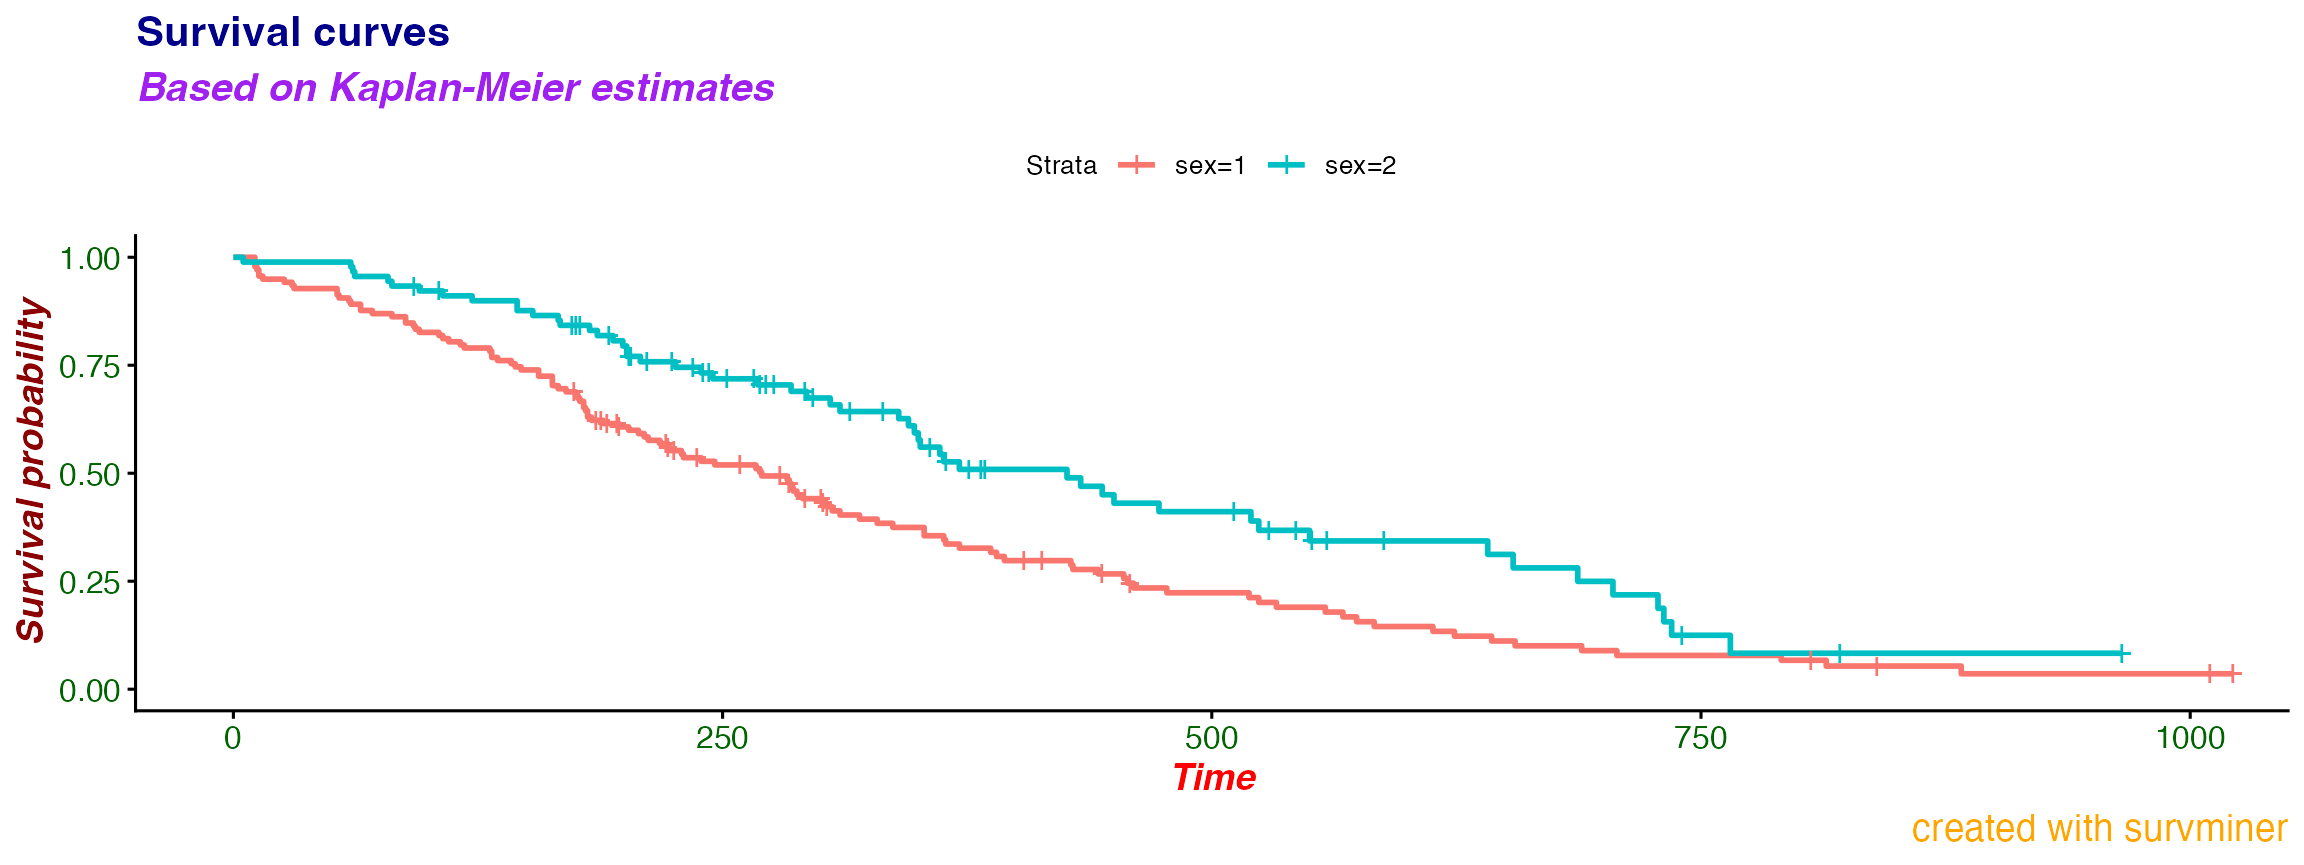
with the plot where every possible text on a plot is specified
ggsurvplot(fit, data = lung,
   title = "Survival curves", subtitle = "Based on Kaplan-Meier estimates",
   caption = "created with survminer",
   font.title = c(16, "bold", "darkblue"),
   font.subtitle = c(15, "bold.italic", "purple"),
   font.caption = c(14, "plain", "orange"),
   font.x = c(14, "bold.italic", "red"),
   font.y = c(14, "bold.italic", "darkred"),
   font.tickslab = c(12, "plain", "darkgreen"))
Risk table
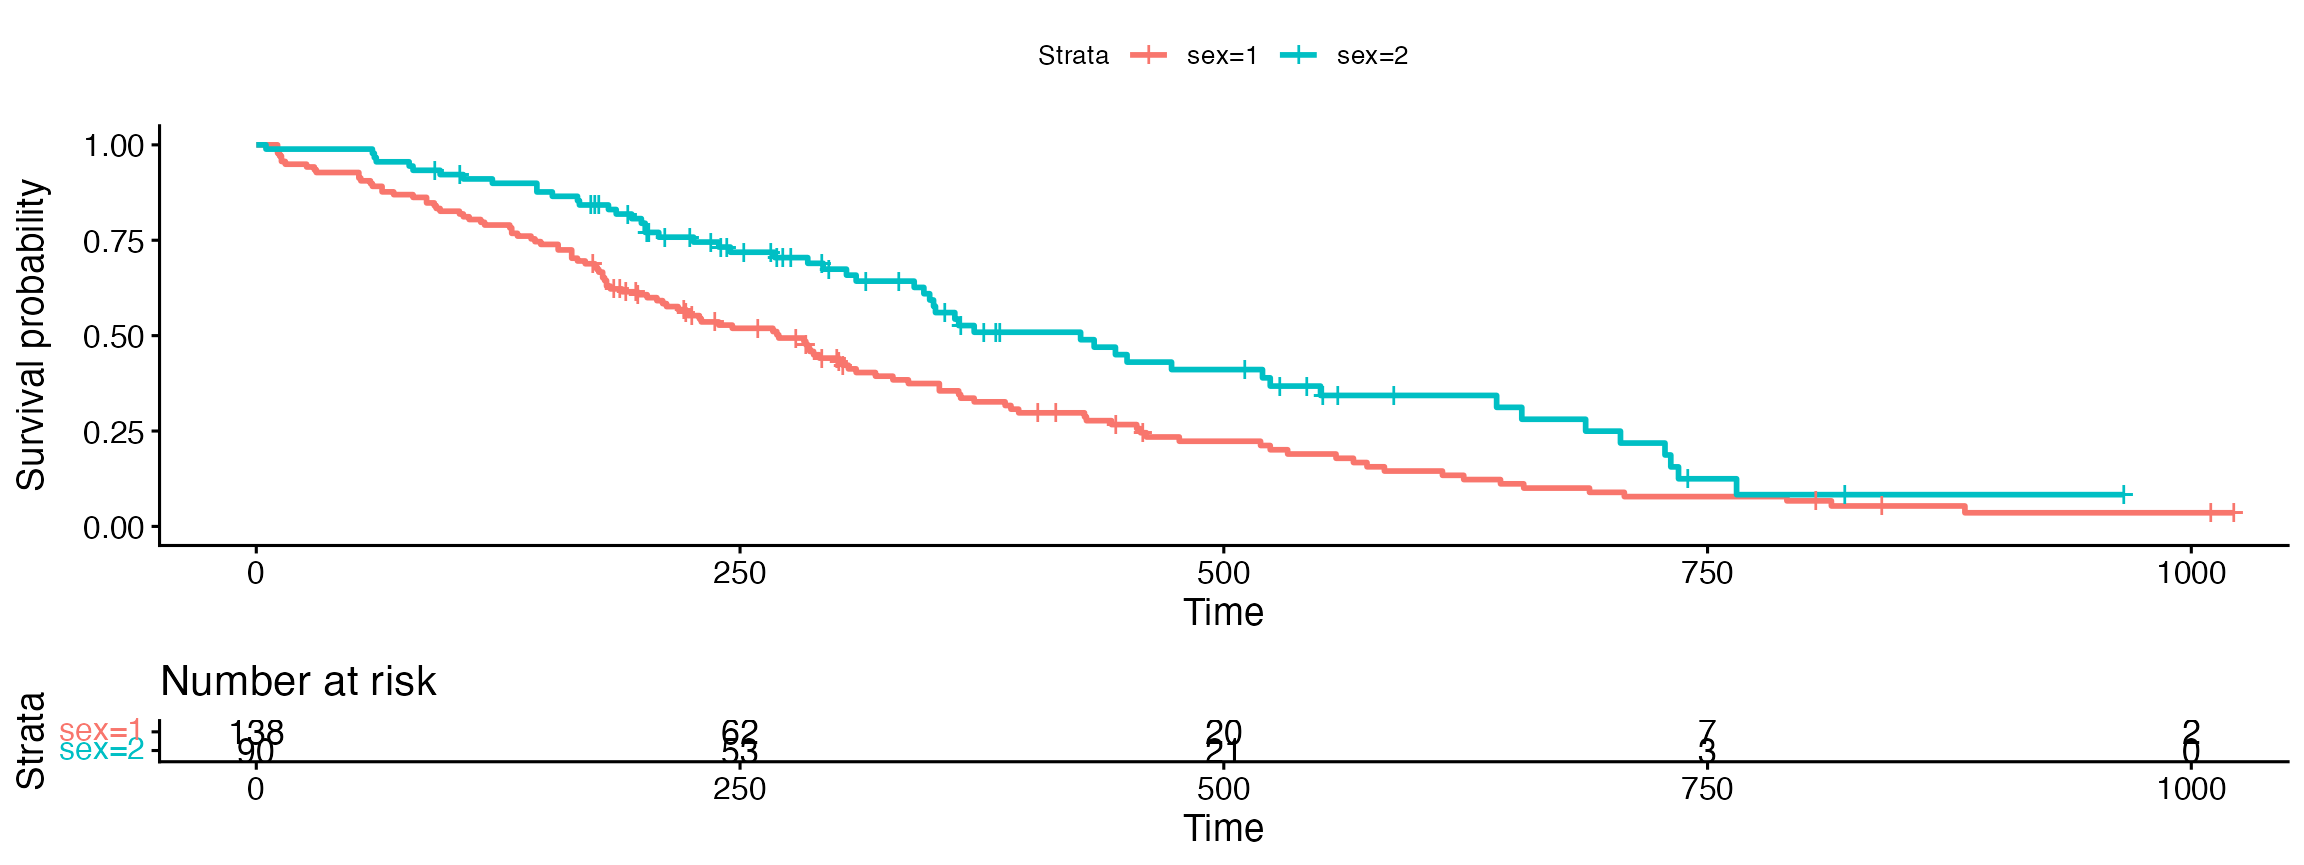
Now allow risk.table to be displayed.
Customized
with the plot where every possible text on a plot and table is specified
ggsurvplot(fit, data = lung,
   title = "Survival curves", subtitle = "Based on Kaplan-Meier estimates",
   caption = "created with survminer",
   font.title = c(16, "bold", "darkblue"),
   font.subtitle = c(15, "bold.italic", "purple"),
   font.caption = c(14, "plain", "orange"),
   font.x = c(14, "bold.italic", "red"),
   font.y = c(14, "bold.italic", "darkred"),
   font.tickslab = c(12, "plain", "darkgreen"),
   ########## risk table #########,
   risk.table = TRUE,
   risk.table.title = "Note the risk set sizes",
   risk.table.subtitle = "and remember about censoring.",
   risk.table.caption = "source code: website.com",
   risk.table.height = 0.45)
ncens plot
Finally, allow ncens.plot to be displayed.
Basic
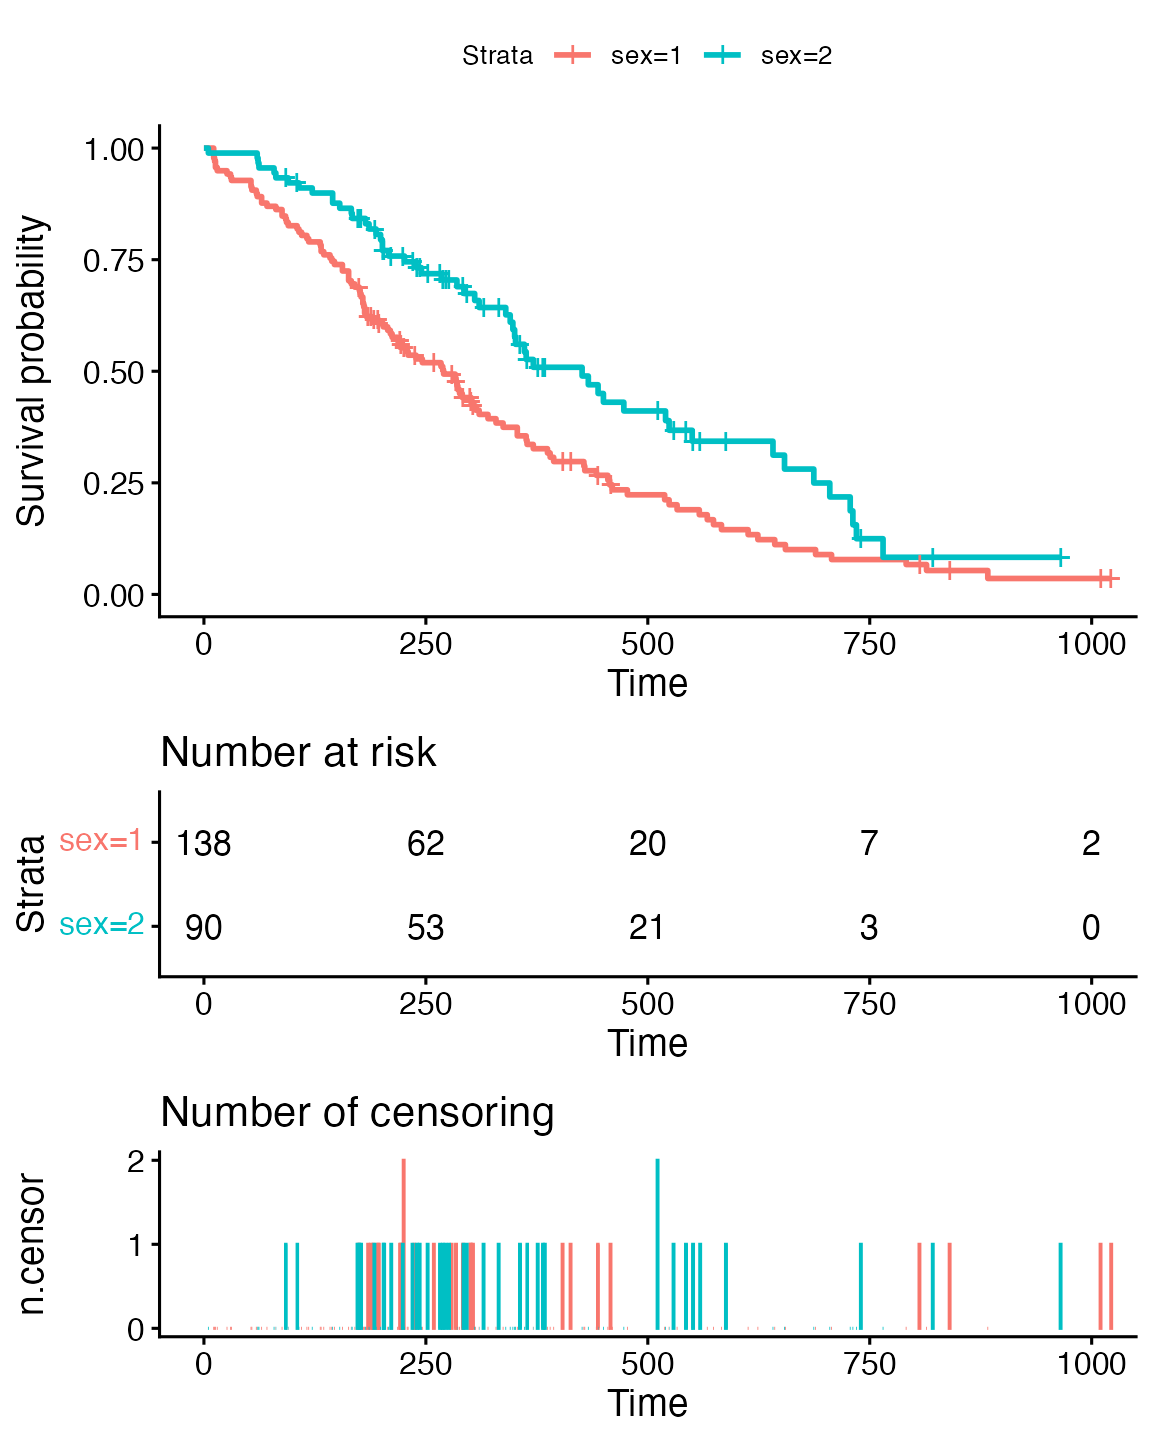
Please compare basic plot with a risk table and a ncens plot
ggsurvplot(fit, data = lung, risk.table = TRUE, ncensor.plot = TRUE)
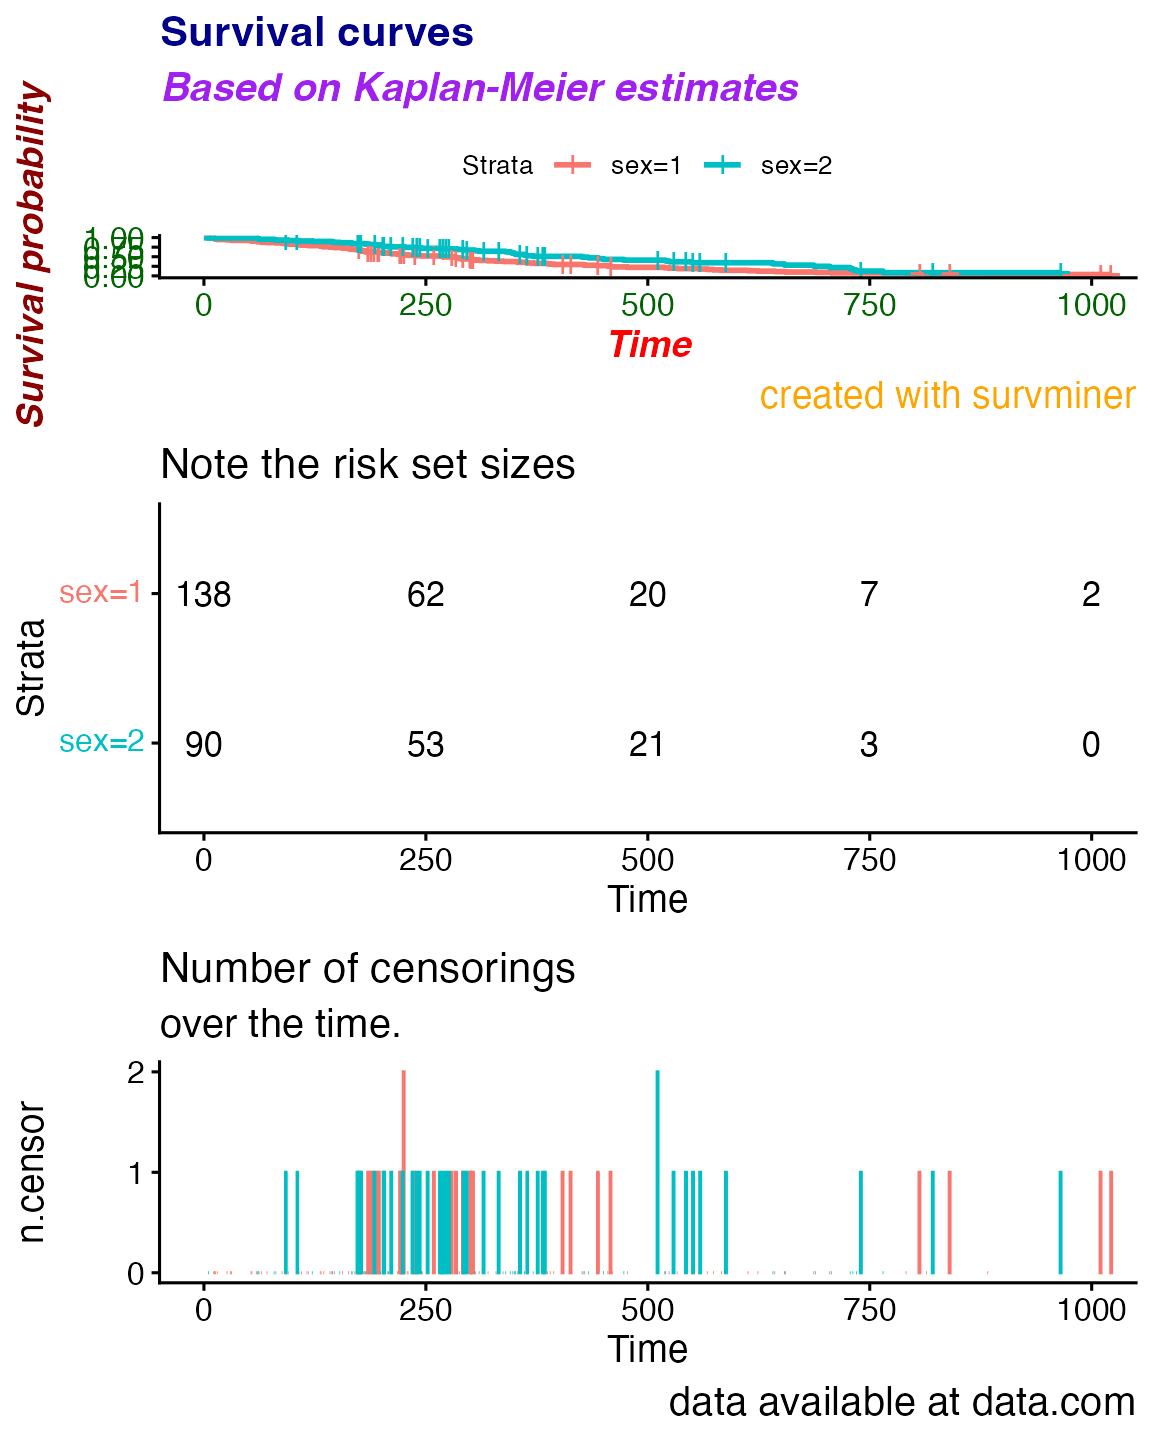
Customized
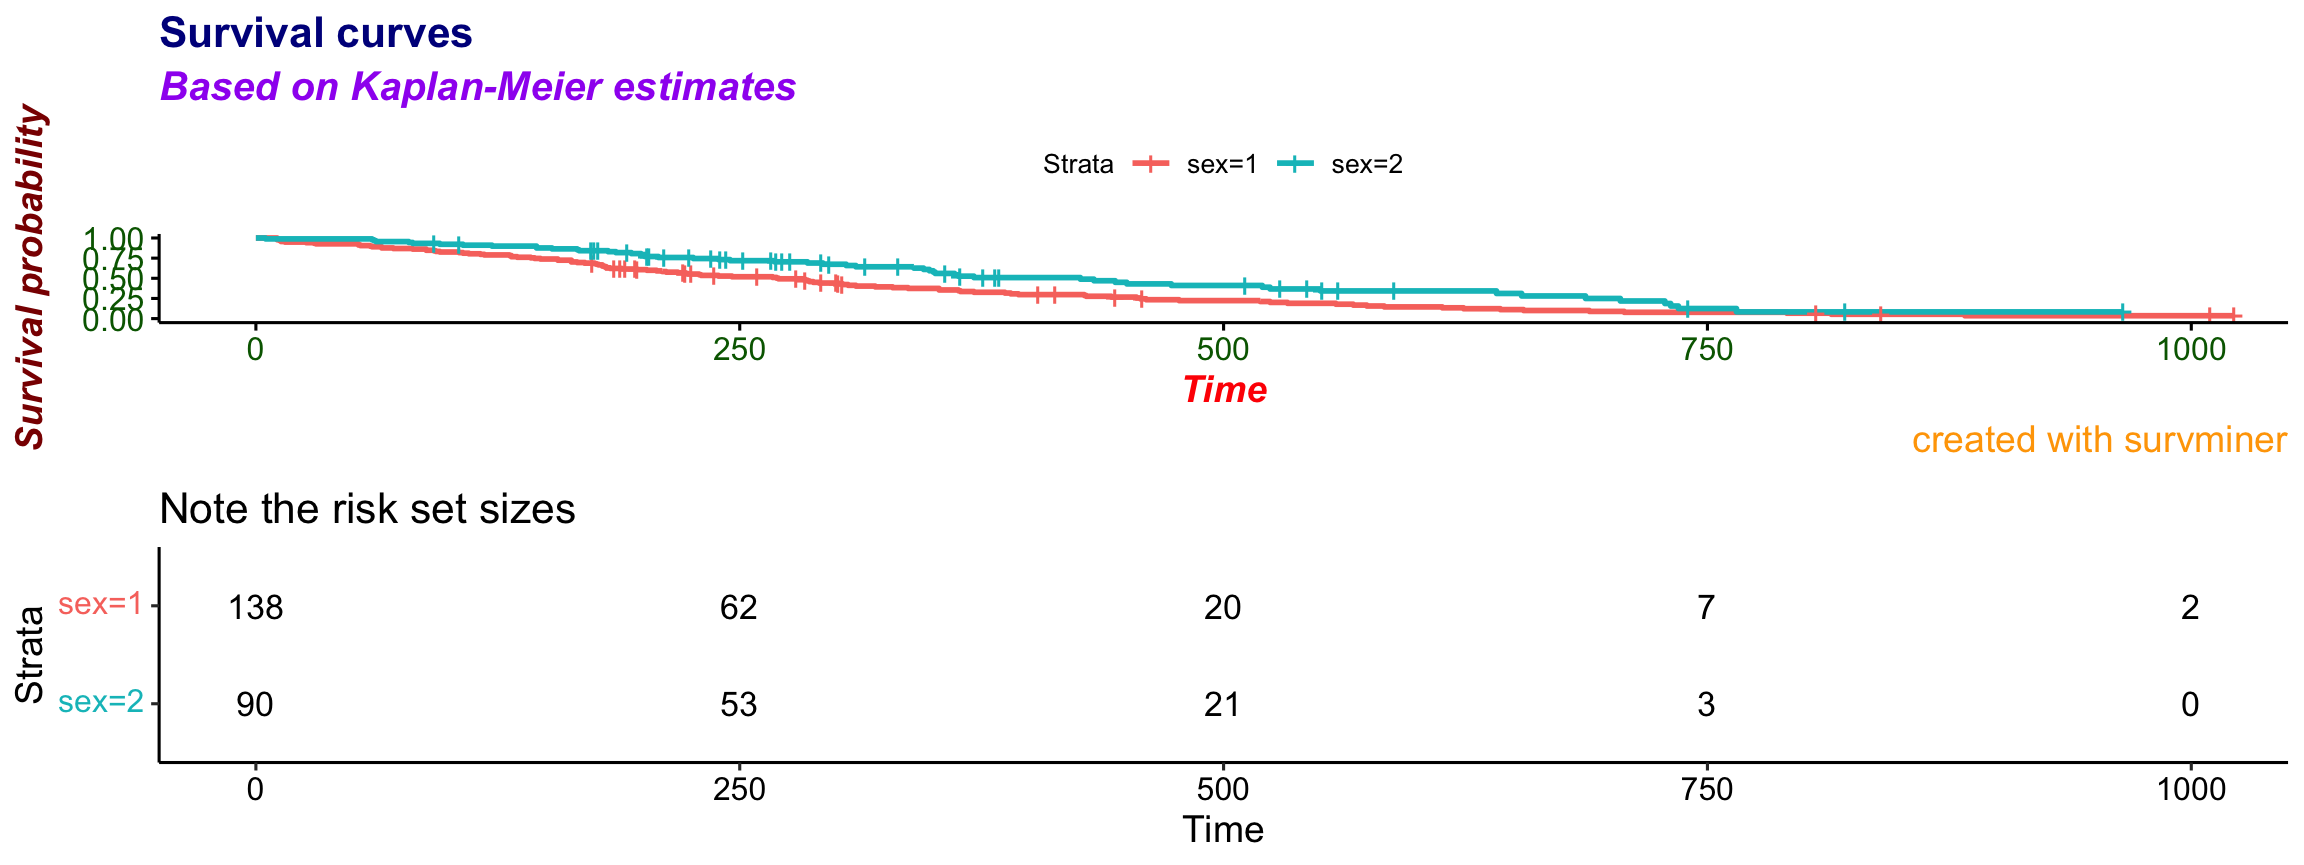
with the full customization
ggsurvplot(fit, data = lung,
   title = "Survival curves", subtitle = "Based on Kaplan-Meier estimates",
   caption = "created with survminer",
   font.title = c(16, "bold", "darkblue"),
   font.subtitle = c(15, "bold.italic", "purple"),
   font.caption = c(14, "plain", "orange"),
   font.x = c(14, "bold.italic", "red"),
   font.y = c(14, "bold.italic", "darkred"),
   font.tickslab = c(12, "plain", "darkgreen"),
   ########## risk table #########,
   risk.table = TRUE,
   risk.table.title = "Note the risk set sizes",
   risk.table.subtitle = "and remember about censoring.",
   risk.table.caption = "source code: website.com",
   risk.table.height = 0.35,
   ncensor.plot = TRUE,
   ncensor.plot.title = "Number of censorings",
   ncensor.plot.subtitle = "over the time.",
   ncensor.plot.caption = "data available at data.com",
   ncensor.plot.height = 0.35)
Notes
- Note that you will probably need to extend the default risk table height and ncens plot height after those customizations.
- Distinct between
titleandsubtitlefor thecurve_plotandrisk.table.titleandrisk.table.subtitlefor thetable/ncens.plot.titleandncens.plot.subtitlefor thencens. - Fonts are set simultaneously for the
curve_plot, for thetableand for thencensparts. This might change in the future.