Add Survival Curves of Pooled Patients onto the Main Plot
Source:R/ggsurvplot_add_all.R
ggsurvplot_add_all.RdAdd survival curves of pooled patients onto the main plot stratified by grouping variables.
Usage
ggsurvplot_add_all(
  fit,
  data,
  legend.title = "Strata",
  legend.labs = NULL,
  pval = FALSE,
  ...
)
Arguments
- fit
an object of class survfit.
- data
a dataset used to fit survival curves. If not supplied then data will be extracted from 'fit' object.
- legend.title
legend title.
- legend.labs
character vector specifying legend labels. Used to replace the names of the strata from the fit. Should be given in the same order as those strata.
- pval
logical value, a numeric or a string. If logical and TRUE, the p-value is added on the plot. If numeric, than the computet p-value is substituted with the one passed with this parameter. If character, then the customized string appears on the plot. See examples - Example 3.
- ...
other arguments passed to the
ggsurvplot()function.
Examples
library(survival)
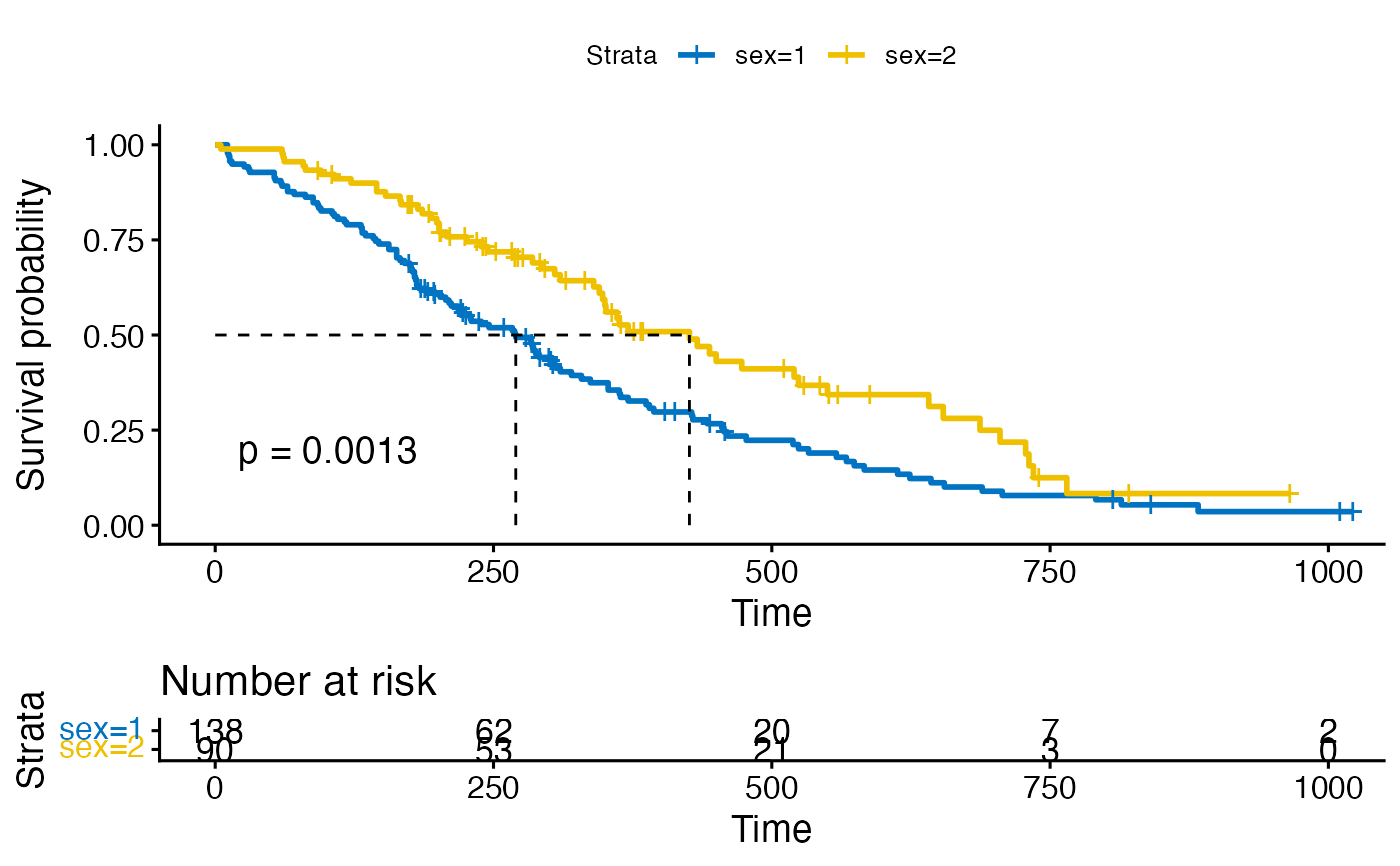
# Fit survival curves
fit <- surv_fit(Surv(time, status) ~ sex, data = lung)
# Visualize survival curves
ggsurvplot(fit, data = lung,
risk.table = TRUE, pval = TRUE,
surv.median.line = "hv", palette = "jco")
#> Ignoring unknown labels:
#> • colour : "Strata"
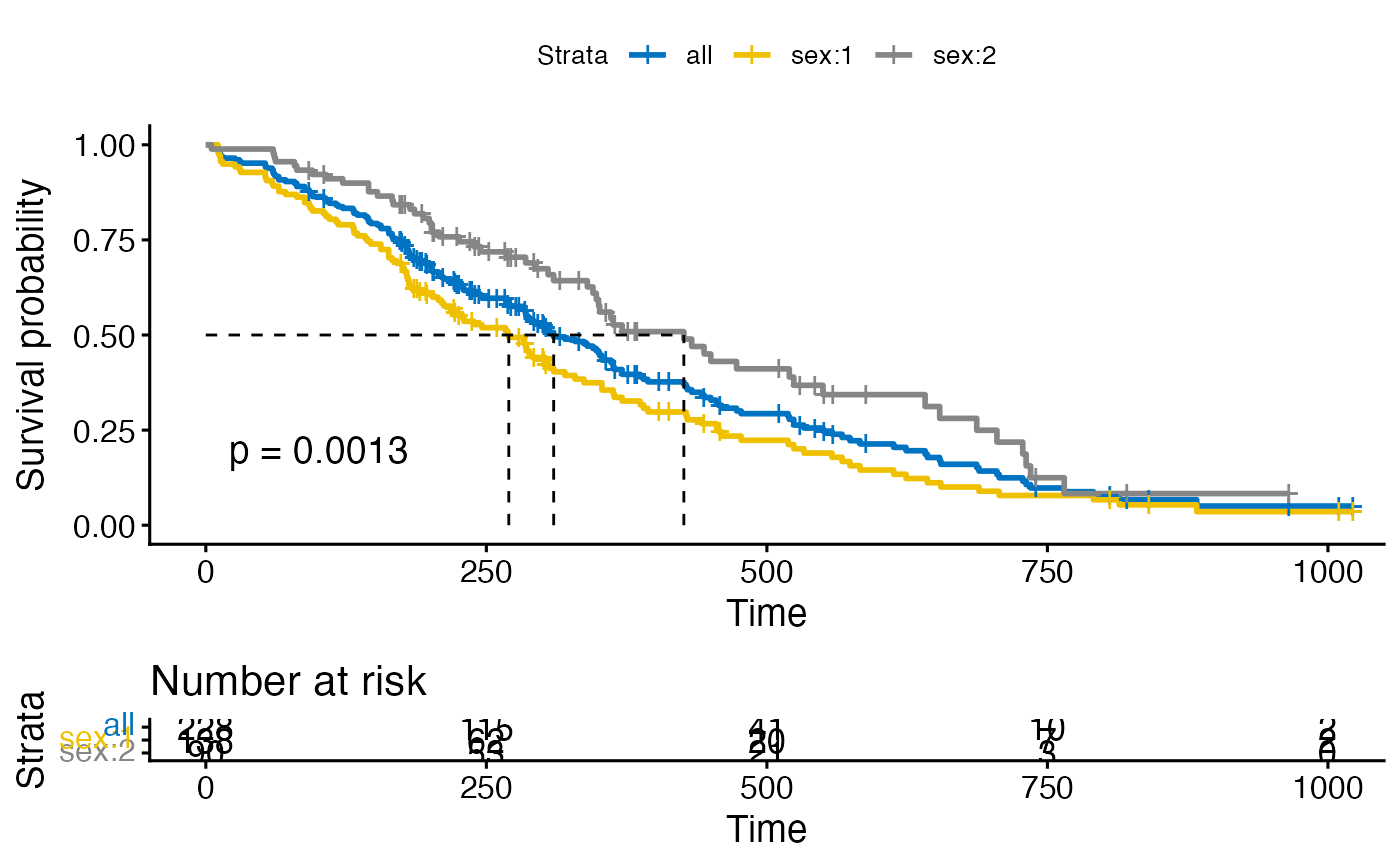
 # Add survival curves of pooled patients (Null model)
# Use add.all = TRUE option
ggsurvplot(fit, data = lung,
risk.table = TRUE, pval = TRUE,
surv.median.line = "hv", palette = "jco",
add.all = TRUE)
#> Ignoring unknown labels:
#> • colour : "Strata"
# Add survival curves of pooled patients (Null model)
# Use add.all = TRUE option
ggsurvplot(fit, data = lung,
risk.table = TRUE, pval = TRUE,
surv.median.line = "hv", palette = "jco",
add.all = TRUE)
#> Ignoring unknown labels:
#> • colour : "Strata"