Change the appearance of the main title, subtitle, caption, axis
labels and text, as well as the legend title and texts. Wrapper around
element_text().
Arguments
- object
character string specifying the plot components. Allowed values include:
"title"for the main title"subtitle"for the plot subtitle"caption"for the plot caption"legend.title"for the legend title"legend.text"for the legend text"x", "xlab", or "x.title"for x axis label"y", "ylab", or "y.title"for y axis label"xy", "xylab", "xy.title" or "axis.title"for both x and y axis labels"x.text"for x axis texts (x axis tick labels)"y.text"for y axis texts (y axis tick labels)"xy.text"or"axis.text"for both x and y axis texts
- size
numeric value specifying the font size, (e.g.:
size = 12).- color
character string specifying the font color, (e.g.:
color = "red").- face
the font face or style. Allowed values include one of
"plain", "bold", "italic", "bold.italic", (e.g.:face = "bold.italic").- family
the font family.
- ...
other arguments to pass to the function
element_text().
Examples
# Load data
data("ToothGrowth")
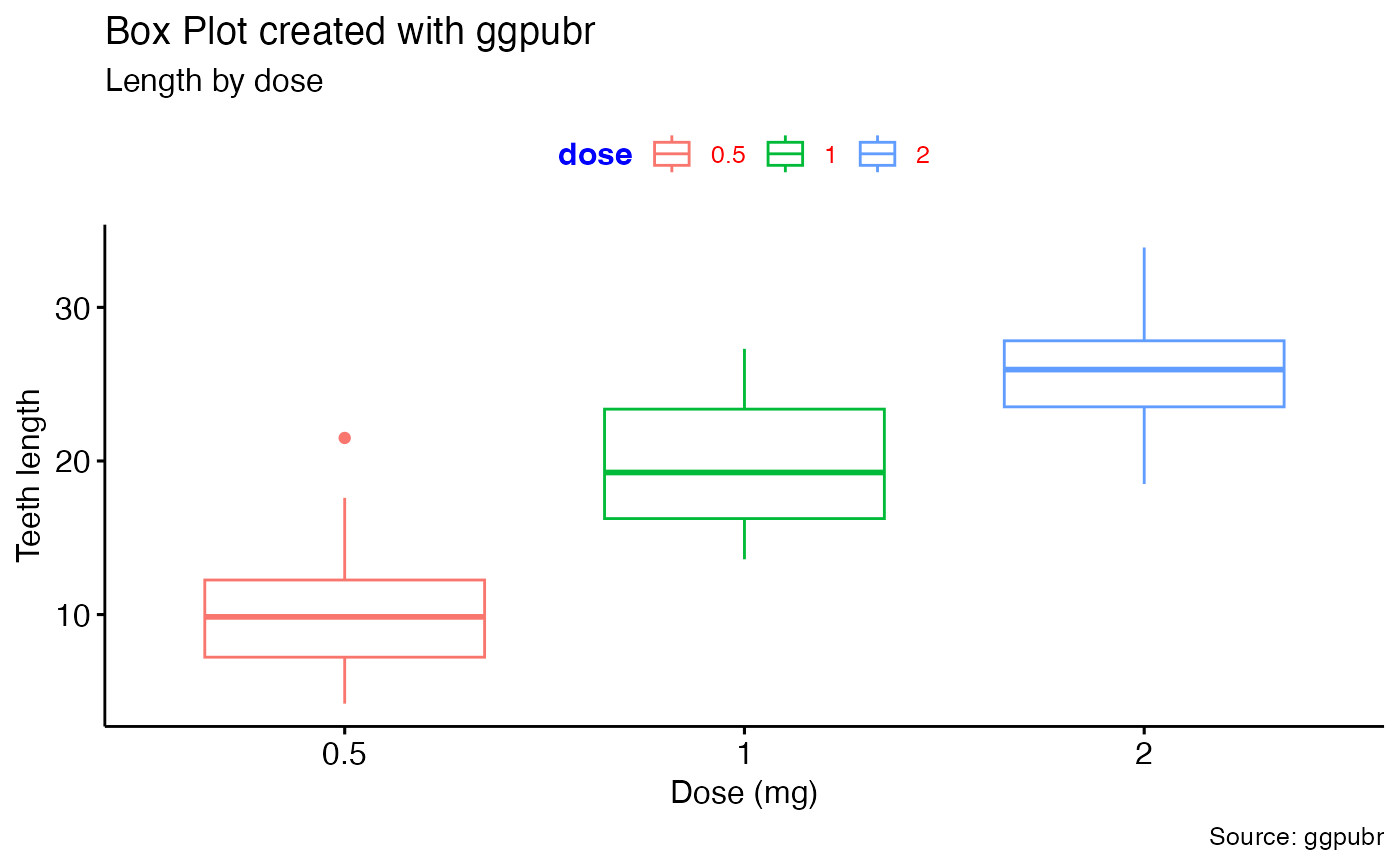
# Basic plot
p <- ggboxplot(ToothGrowth,
x = "dose", y = "len", color = "dose",
title = "Box Plot created with ggpubr",
subtitle = "Length by dose",
caption = "Source: ggpubr",
xlab = "Dose (mg)", ylab = "Teeth length"
)
p
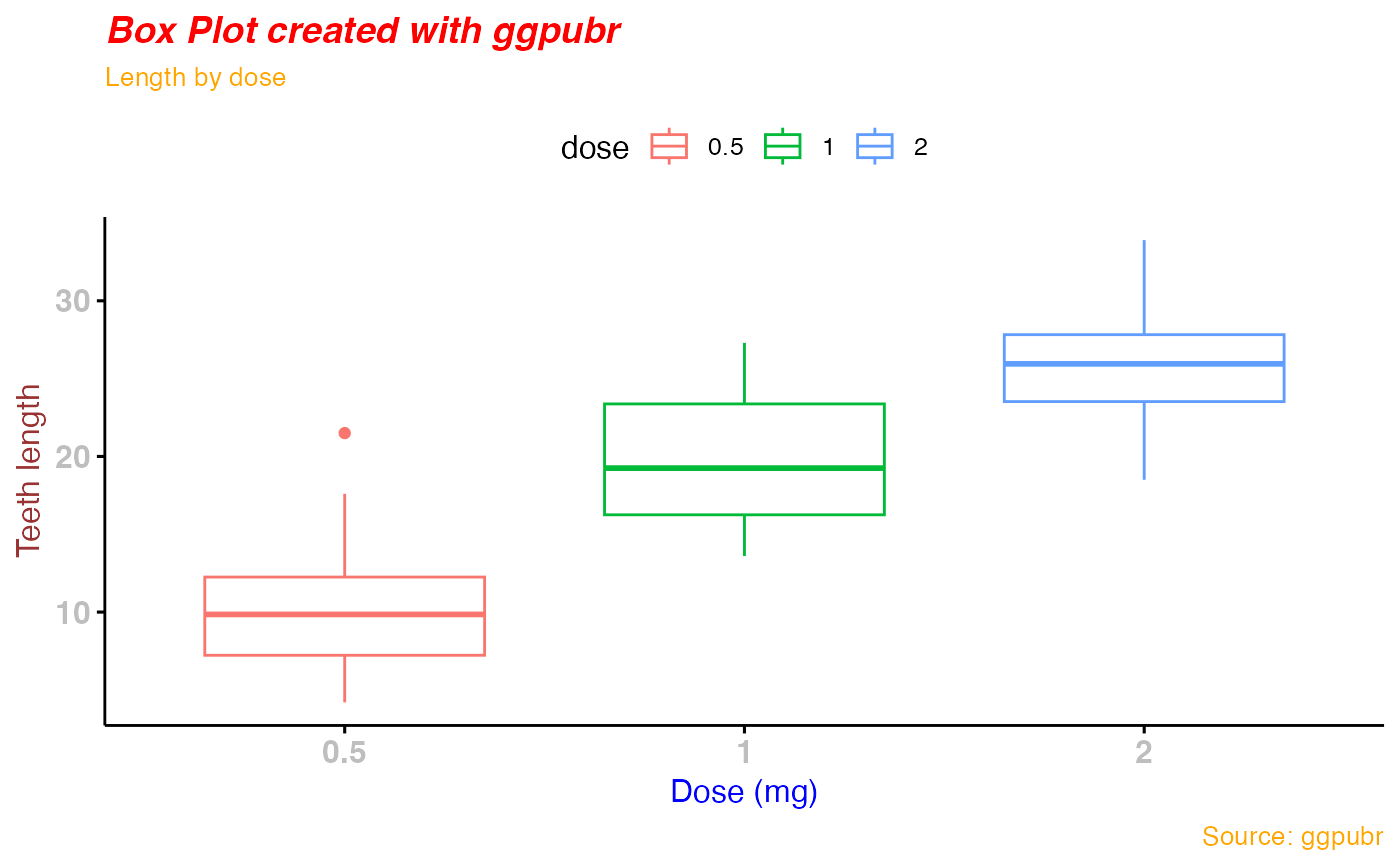
 # Change the appearance of titles and labels
p +
font("title", size = 14, color = "red", face = "bold.italic") +
font("subtitle", size = 10, color = "orange") +
font("caption", size = 10, color = "orange") +
font("xlab", size = 12, color = "blue") +
font("ylab", size = 12, color = "#993333") +
font("xy.text", size = 12, color = "gray", face = "bold")
# Change the appearance of titles and labels
p +
font("title", size = 14, color = "red", face = "bold.italic") +
font("subtitle", size = 10, color = "orange") +
font("caption", size = 10, color = "orange") +
font("xlab", size = 12, color = "blue") +
font("ylab", size = 12, color = "#993333") +
font("xy.text", size = 12, color = "gray", face = "bold")
 # Change the appearance of legend title and texts
p +
font("legend.title", color = "blue", face = "bold") +
font("legend.text", color = "red")
# Change the appearance of legend title and texts
p +
font("legend.title", color = "blue", face = "bold") +
font("legend.text", color = "red")