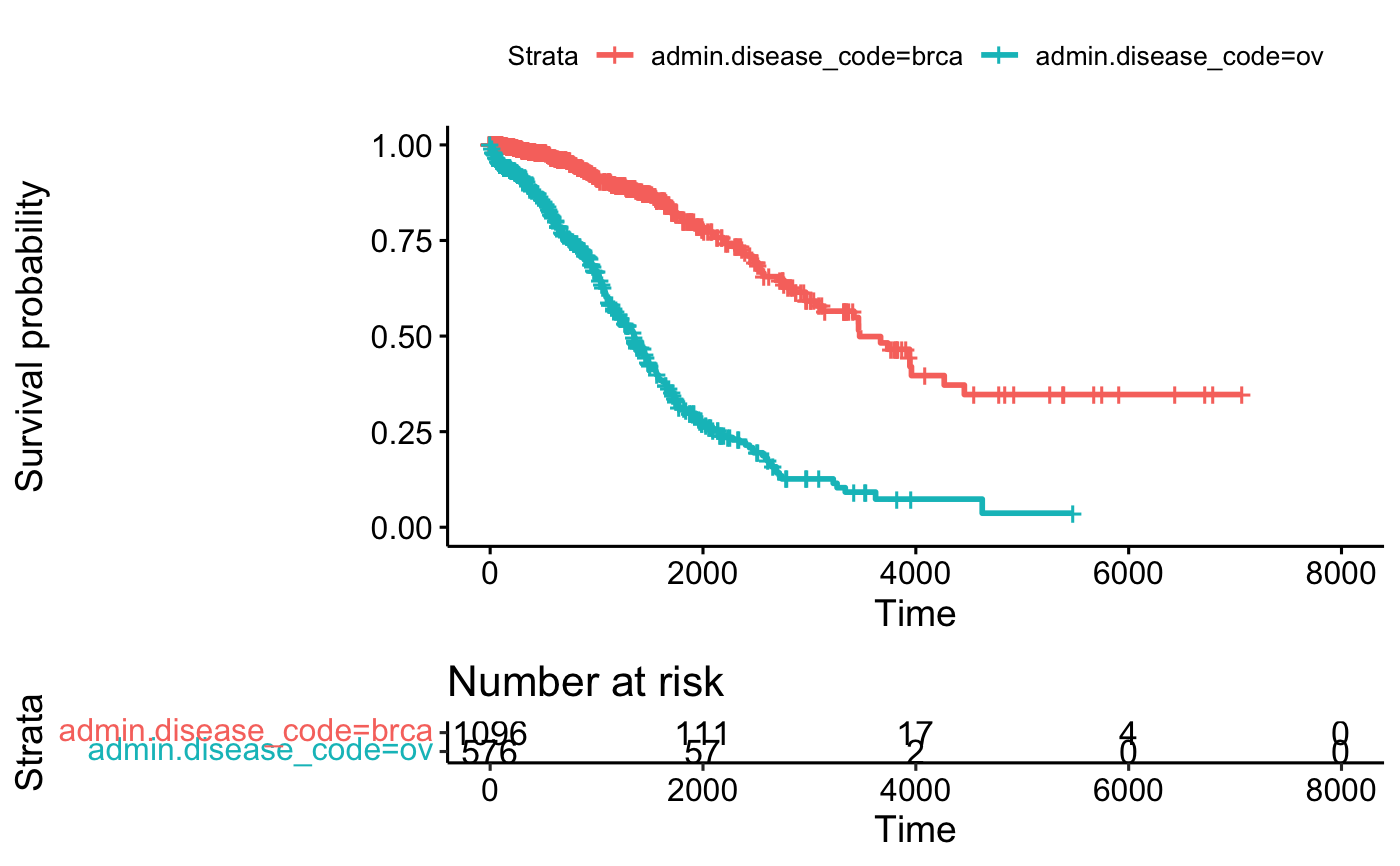
Breat and Ovarian cancers survival information from the
RTCGA.clinical R/Bioconductor package.http://rtcga.github.io/RTCGA/.
A data frame with 1674 rows and 4 columns.
 - times: follow-up time;
 - bcr_patient_barcode: Patient bar code;
 - patient.vital_status = survival status. 0 = alive, 1 = dead;
 - admin.disease_code: disease code. brca = breast cancer, ov = ovarian
 cancer.
Source
From the RTCGA.clinical R/Bioconductor package. The data is generated as follow:
# Installing RTCGA.clinical
source("https://bioconductor.org/biocLite.R")
biocLite("RTCGA.clinical")

# Generating the BRCAOV survival information
library(RTCGA.clinical)
survivalTCGA(BRCA.clinical, OV.clinical,
extract.cols = "admin.disease_code") -> BRCAOV.survInfo
Examples
data(BRCAOV.survInfo)
library(survival)
fit <- survfit(Surv(times, patient.vital_status) ~ admin.disease_code,
           data = BRCAOV.survInfo)
ggsurvplot(fit, data = BRCAOV.survInfo, risk.table = TRUE)
#> Ignoring unknown labels:
#> • colour : "Strata"