Diagnostic Plots for Cox Proportional Hazards Model with ggplot2
Source:R/ggcoxdiagnostics.R
ggcoxdiagnostics.RdDisplays diagnostics graphs presenting goodness of Cox Proportional Hazards Model fit, that can be calculated with coxph function.
Usage
ggcoxdiagnostics(
  fit,
  type = c("martingale", "deviance", "score", "schoenfeld", "dfbeta", "dfbetas",
    "scaledsch", "partial"),
  ...,
  linear.predictions = type %in% c("martingale", "deviance"),
  ox.scale = ifelse(linear.predictions, "linear.predictions", "observation.id"),
  hline = TRUE,
  sline = TRUE,
  sline.se = TRUE,
  hline.col = "red",
  hline.size = 1,
  hline.alpha = 1,
  hline.yintercept = 0,
  hline.lty = "dashed",
  sline.col = "blue",
  sline.size = 1,
  sline.alpha = 0.3,
  sline.lty = "dashed",
  point.col = "black",
  point.size = 1,
  point.shape = 19,
  point.alpha = 1,
  title = NULL,
  subtitle = NULL,
  caption = NULL,
  ggtheme = ggplot2::theme_bw()
)
Arguments
- fit
an object of class coxph.object - created with coxph function.
- type
the type of residuals to present on Y axis of a diagnostic plot. The same as in residuals.coxph: character string indicating the type of residual desired. Possible values are
"martingale", "deviance", "score", "schoenfeld", "dfbeta", "dfbetas"and"scaledsch". Only enough of the string to determine a unique match is required.- ...
further arguments passed to
residuals.coxphor to the functionggparfor customizing the plot.- linear.predictions
(deprecated, see
ox.scale) a logical value indicating whether to show linear predictions for observations (TRUE) or just indexed of observations (FALSE) on X axis.- ox.scale
one value from
c("linear.predictions", "observation.id", "time"). It defines what will be presented on OX scale. Possible values: y hat for"linear.predictions", Id of an observation for"observation.id"or Time for"time".- hline
a logical - should the horizontal line be added to highlight the
Y=0level.- sline, sline.se
a logical - should the smooth line be added to highlight the local average for residuals.
- hline.col, hline.size, hline.lty, hline.alpha, hline.yintercept
color, size, linetype, visibility and Y-axis coordinate to be used for geom_hline. Used only when
hline = TRUE.- sline.col, sline.size, sline.lty, sline.alpha
color, size, linetype and visibility to be used for geom_smooth. Used only when
sline = TRUE.- point.col, point.size, point.shape, point.alpha
color, size, shape and visibility to be used for points.
- title, subtitle, caption
main title, subtitle and caption.
- ggtheme
function, ggplot2 theme name. Default value is ggplot2::theme_bw(). Allowed values include ggplot2 official themes: see
theme.
Author
Marcin Kosinski , m.p.kosinski@gmail.com
Examples
library(survival)
coxph.fit2 <- coxph(Surv(futime, fustat) ~ age + ecog.ps, data=ovarian)
ggcoxdiagnostics(coxph.fit2, type = "deviance")
#> `geom_smooth()` using formula = 'y ~ x'
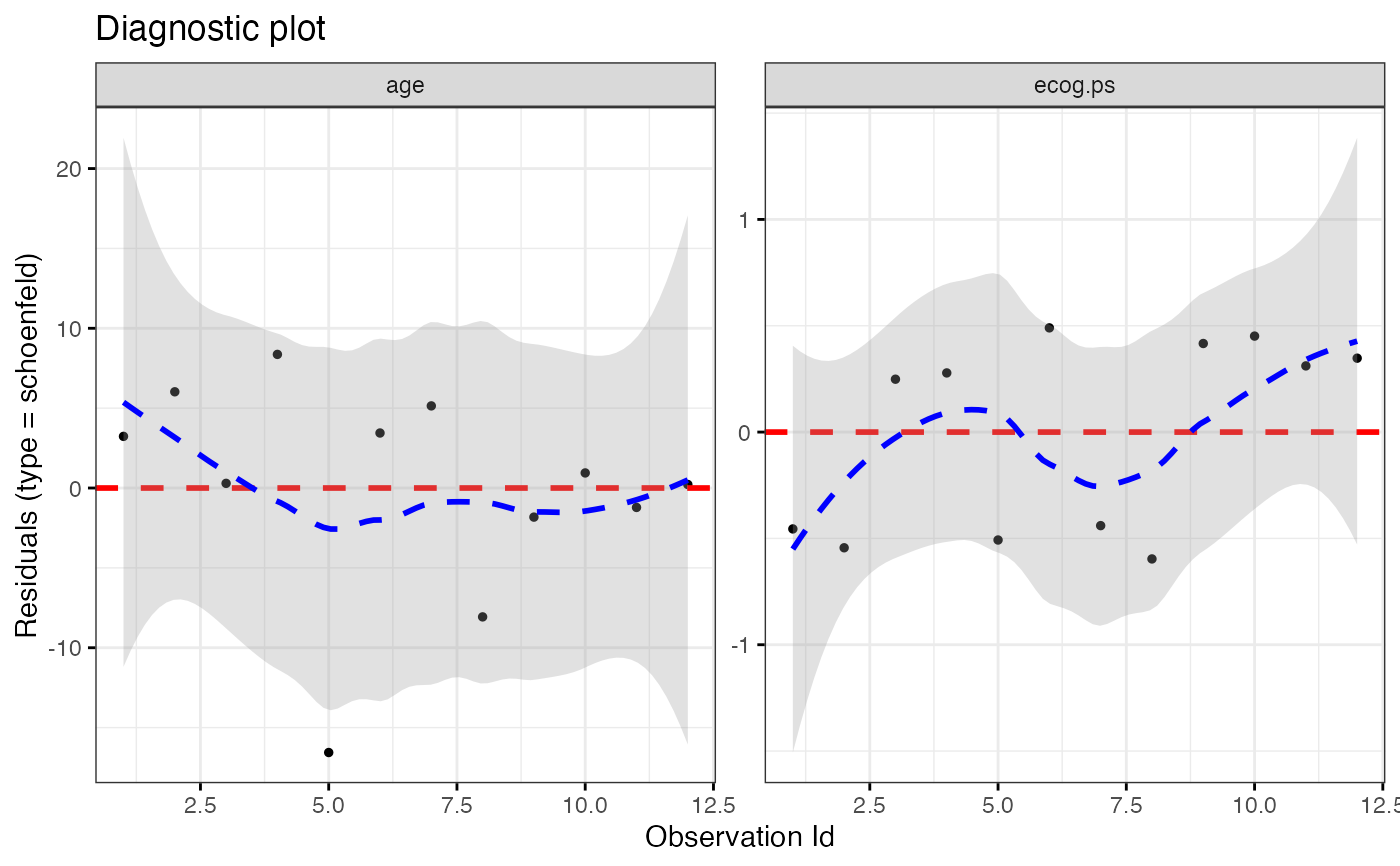
 ggcoxdiagnostics(coxph.fit2, type = "schoenfeld", title = "Diagnostic plot")
#> `geom_smooth()` using formula = 'y ~ x'
ggcoxdiagnostics(coxph.fit2, type = "schoenfeld", title = "Diagnostic plot")
#> `geom_smooth()` using formula = 'y ~ x'
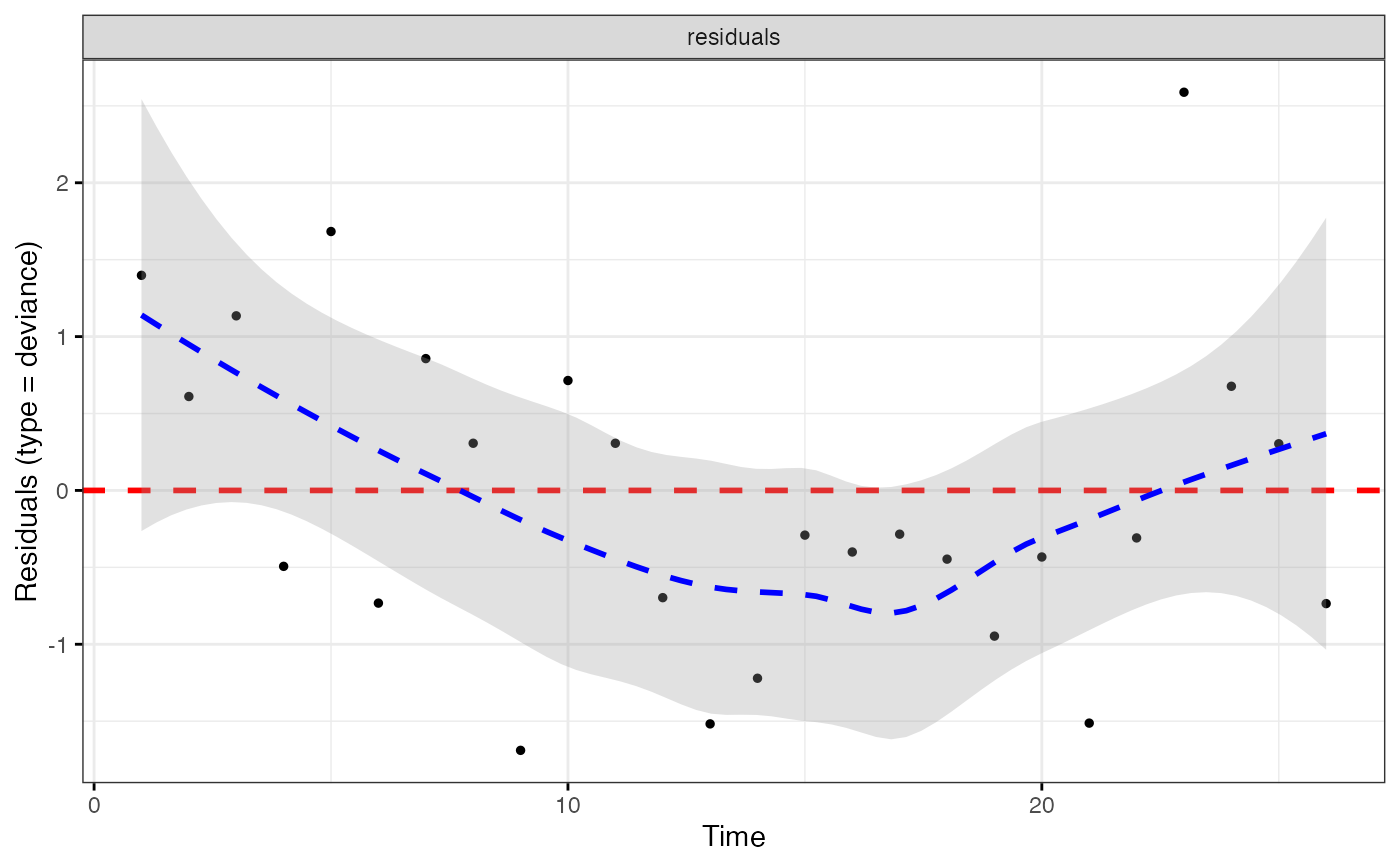
 ggcoxdiagnostics(coxph.fit2, type = "deviance", ox.scale = "time")
#> Warning: ox.scale='time' works only with type=schoenfeld/scaledsch
#> `geom_smooth()` using formula = 'y ~ x'
ggcoxdiagnostics(coxph.fit2, type = "deviance", ox.scale = "time")
#> Warning: ox.scale='time' works only with type=schoenfeld/scaledsch
#> `geom_smooth()` using formula = 'y ~ x'
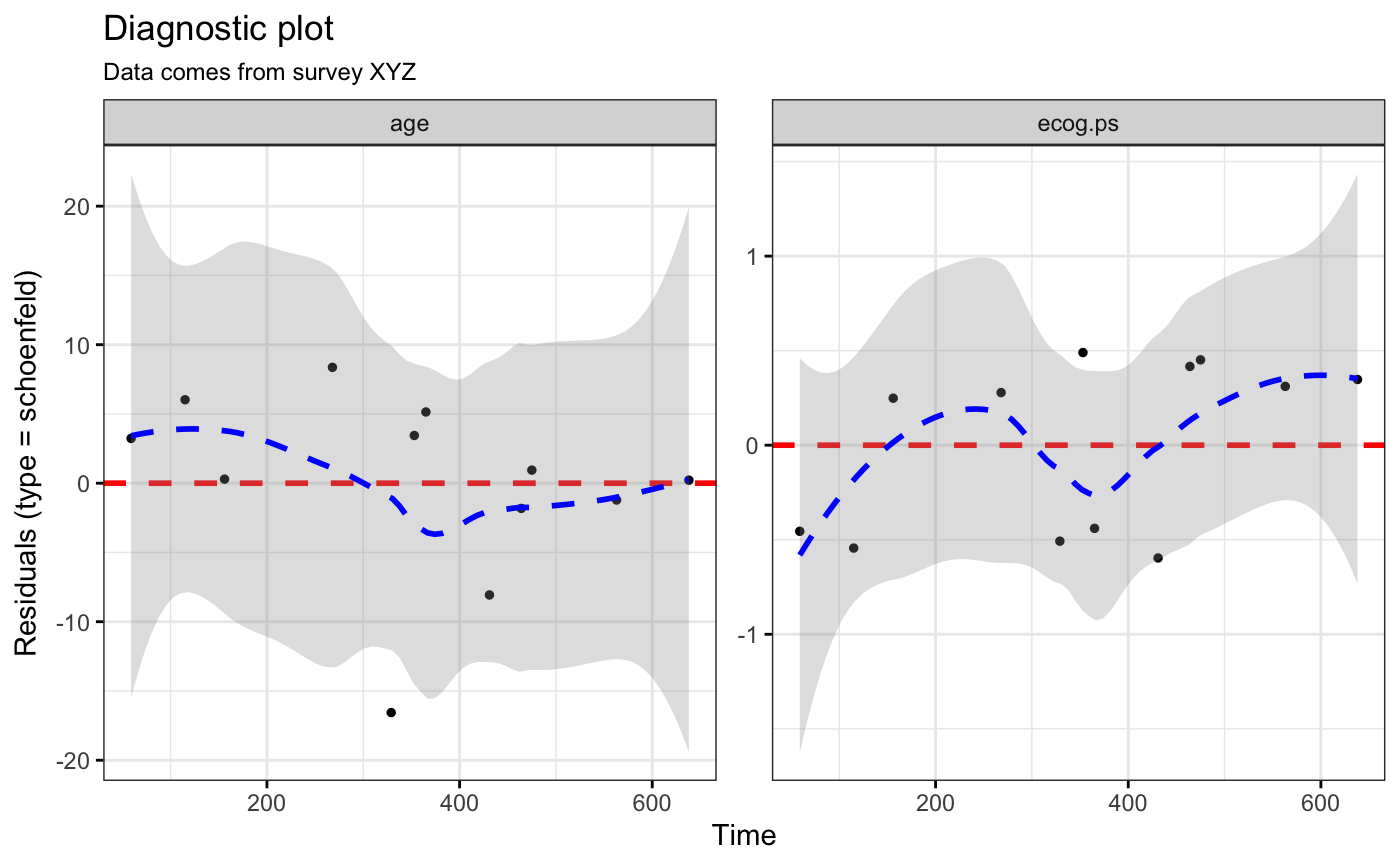
 ggcoxdiagnostics(coxph.fit2, type = "schoenfeld", ox.scale = "time",
title = "Diagnostic plot", subtitle = "Data comes from survey XYZ",
font.subtitle = 9)
#> `geom_smooth()` using formula = 'y ~ x'
ggcoxdiagnostics(coxph.fit2, type = "schoenfeld", ox.scale = "time",
title = "Diagnostic plot", subtitle = "Data comes from survey XYZ",
font.subtitle = 9)
#> `geom_smooth()` using formula = 'y ~ x'
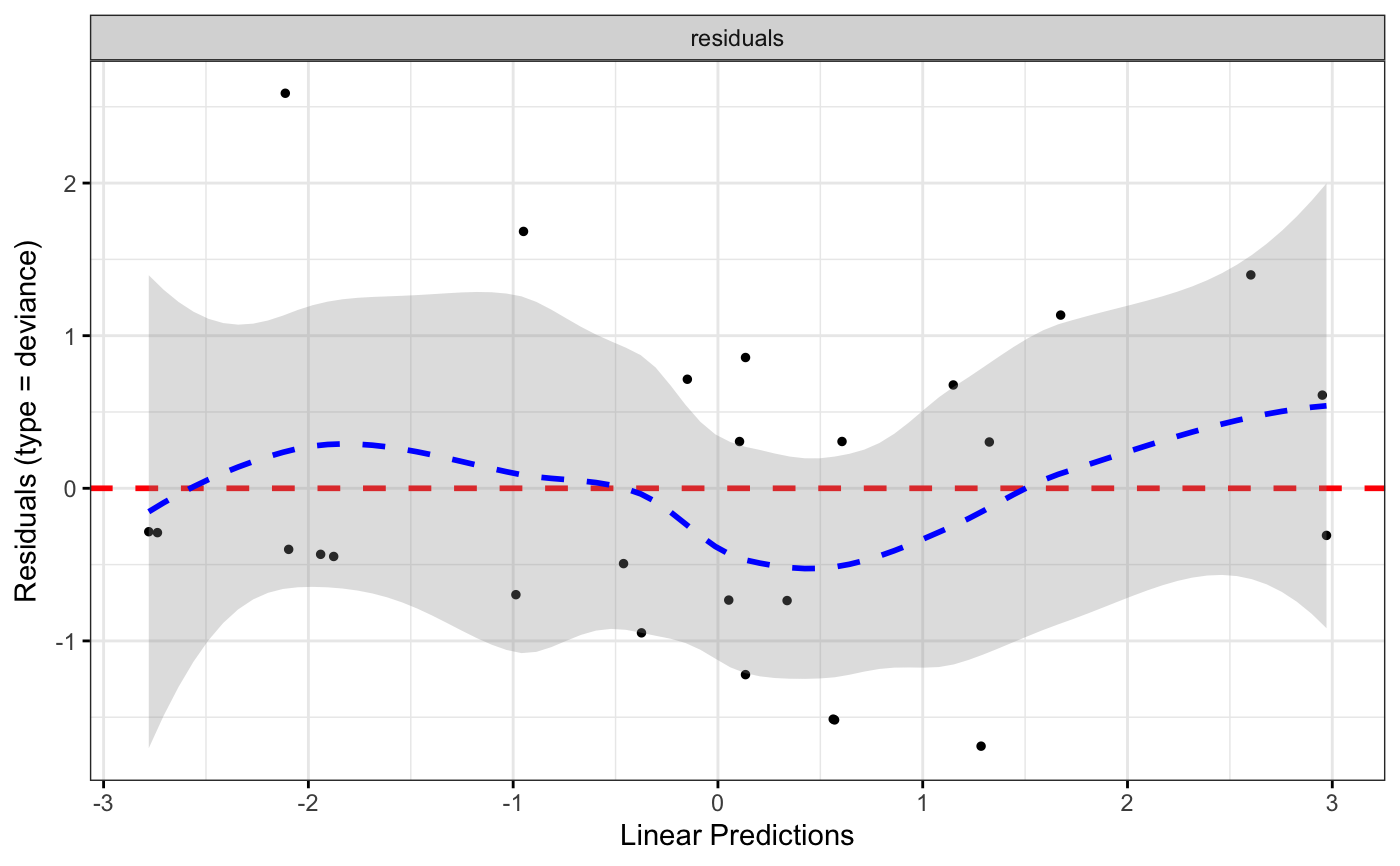
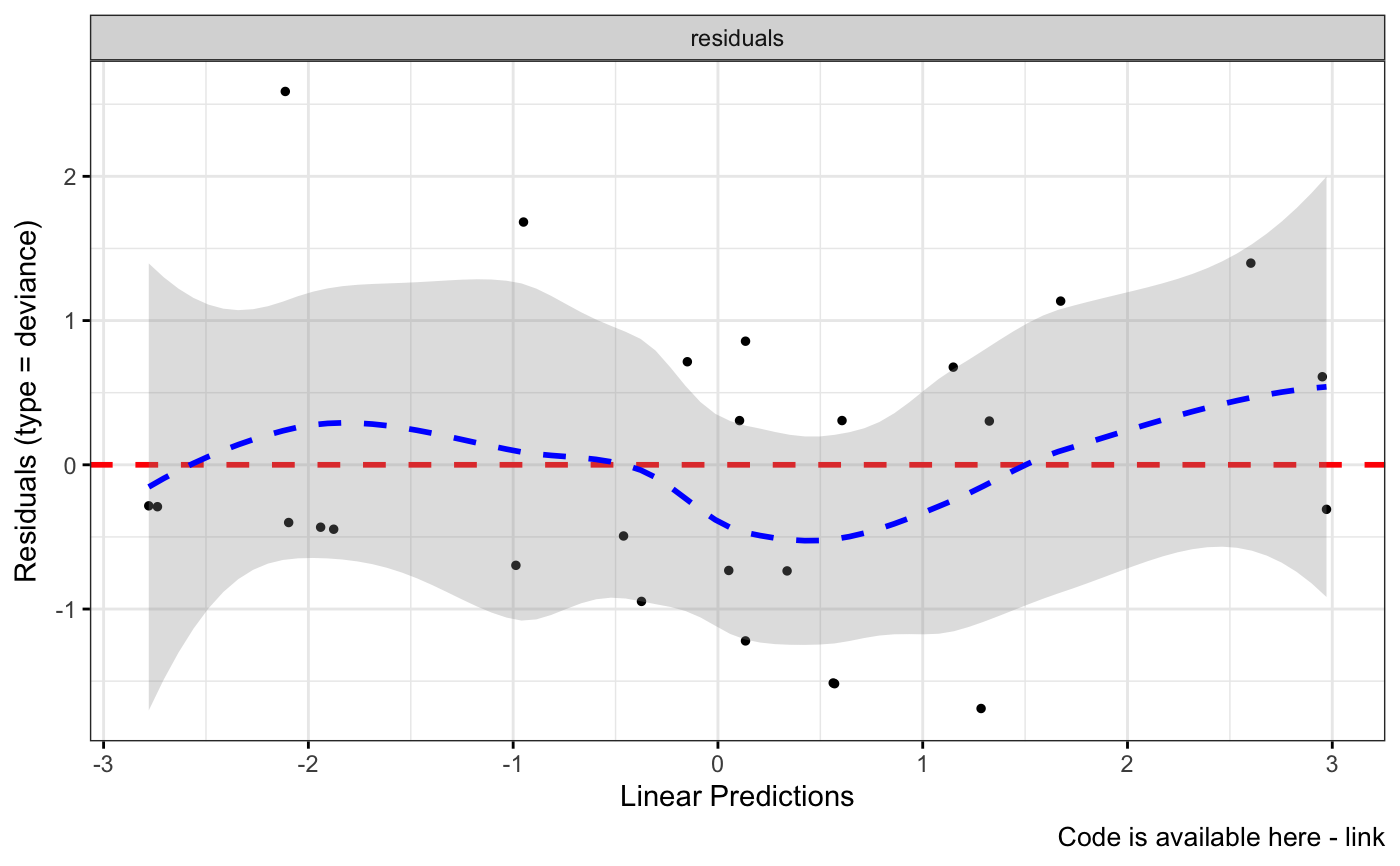
 ggcoxdiagnostics(coxph.fit2, type = "deviance", ox.scale = "linear.predictions",
caption = "Code is available here - link", font.caption = 10)
#> `geom_smooth()` using formula = 'y ~ x'
ggcoxdiagnostics(coxph.fit2, type = "deviance", ox.scale = "linear.predictions",
caption = "Code is available here - link", font.caption = 10)
#> `geom_smooth()` using formula = 'y ~ x'
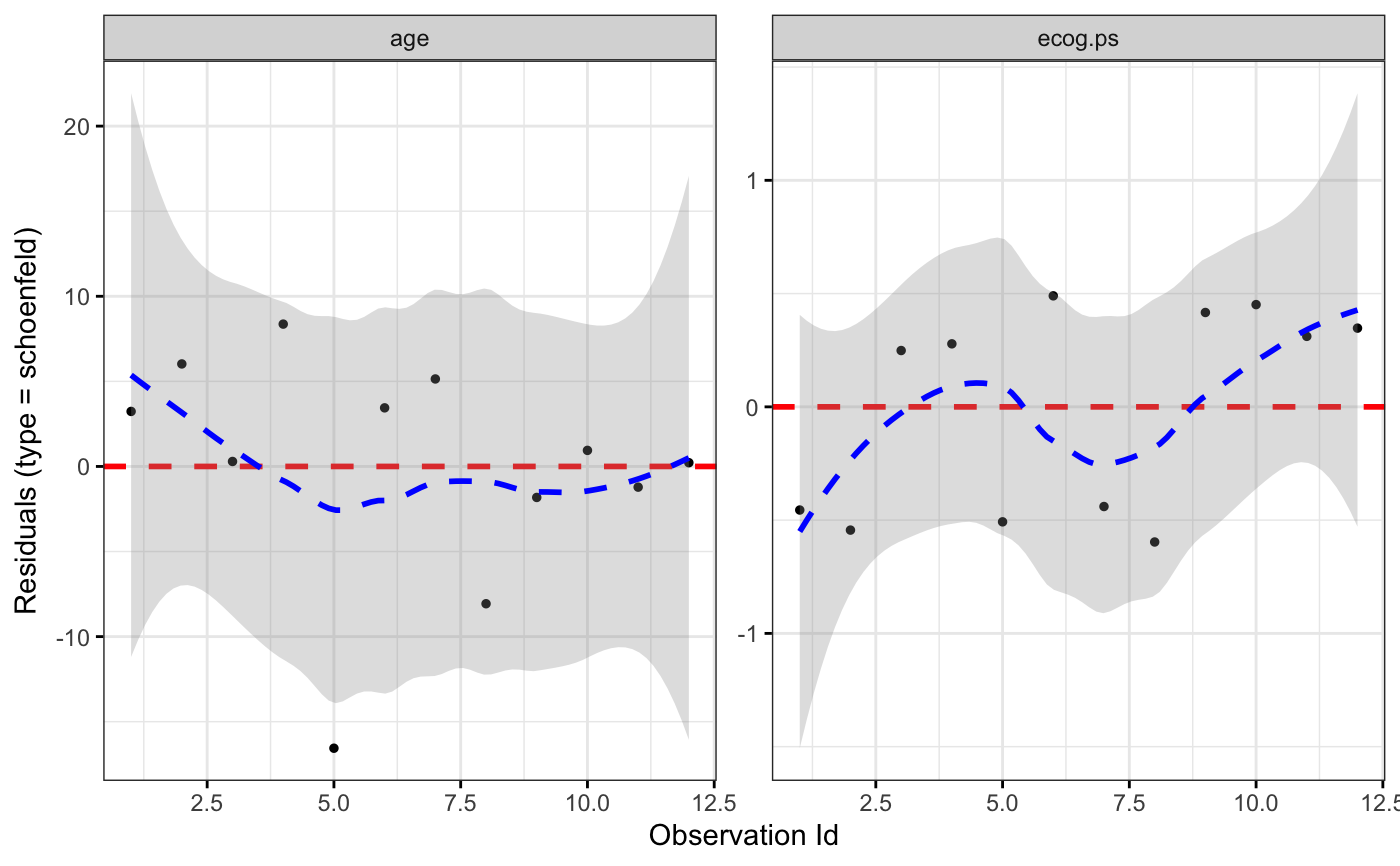
 ggcoxdiagnostics(coxph.fit2, type = "schoenfeld", ox.scale = "observation.id")
#> `geom_smooth()` using formula = 'y ~ x'
ggcoxdiagnostics(coxph.fit2, type = "schoenfeld", ox.scale = "observation.id")
#> `geom_smooth()` using formula = 'y ~ x'
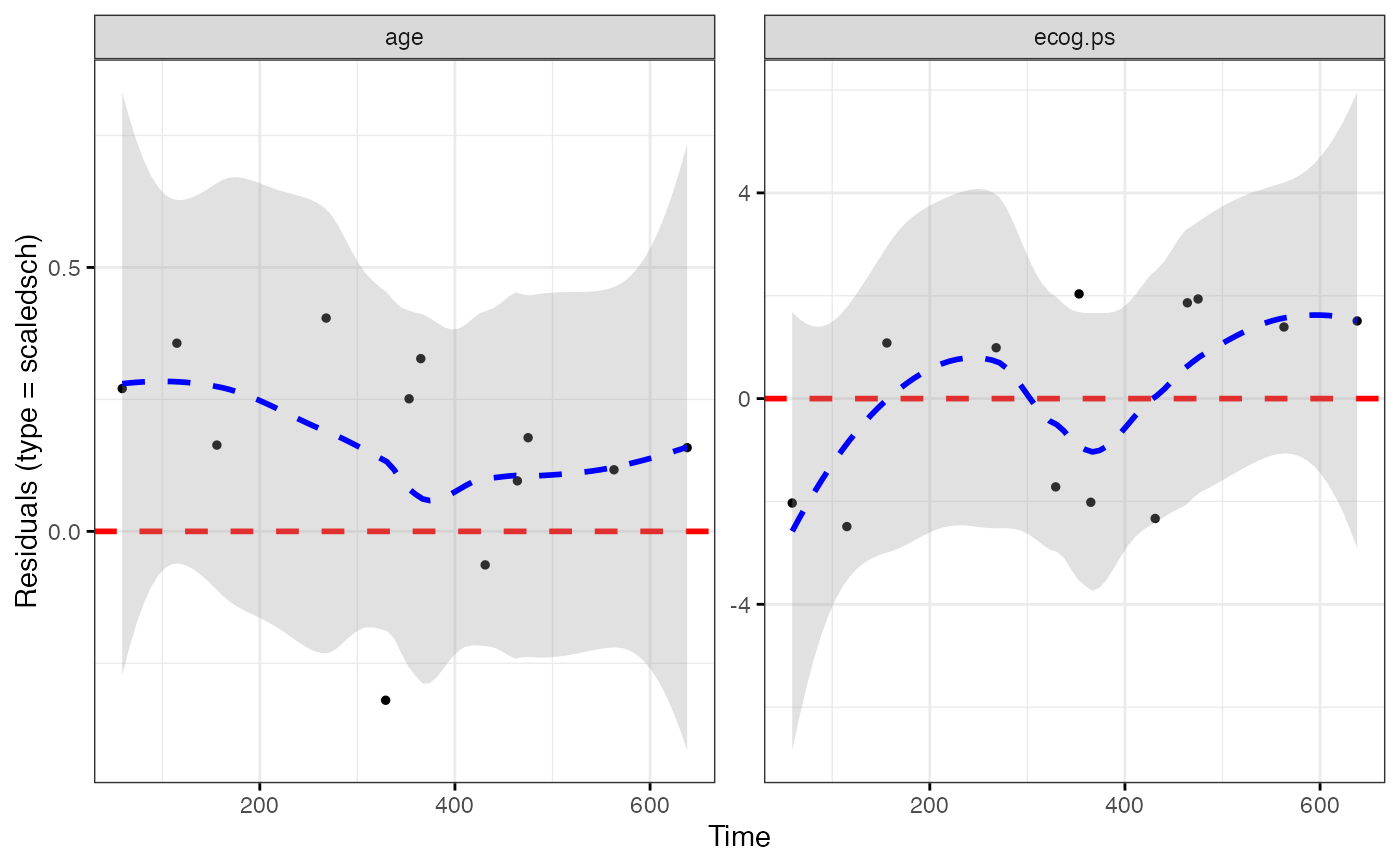
 ggcoxdiagnostics(coxph.fit2, type = "scaledsch", ox.scale = "time")
#> `geom_smooth()` using formula = 'y ~ x'
ggcoxdiagnostics(coxph.fit2, type = "scaledsch", ox.scale = "time")
#> `geom_smooth()` using formula = 'y ~ x'