Plot survival tables:
ggrisktable(): Plot the number at risk table.ggcumevents(): Plot the cumulative number of events table.ggcumcensor(): Plot the cumulative number of censored subjects, the number of subjects who exit the risk set, without an event, at time t. Normally, users don't need to use this function directly.ggsurvtable(): Generic function to plot any survival tables.
Normally, users don't need to use this function directly. Internally used by the function
ggsurvplot.
Usage
ggrisktable(
  fit,
  data = NULL,
  risk.table.type = c("absolute", "percentage", "abs_pct", "nrisk_cumcensor",
    "nrisk_cumevents"),
  ...
)

ggcumevents(fit, data = NULL, ...)

ggcumcensor(fit, data = NULL, ...)

ggsurvtable(
  fit,
  data = NULL,
  survtable = c("cumevents", "cumcensor", "risk.table"),
  risk.table.type = c("absolute", "percentage", "abs_pct", "nrisk_cumcensor",
    "nrisk_cumevents"),
  title = NULL,
  risk.table.title = NULL,
  cumevents.title = title,
  cumcensor.title = title,
  color = "black",
  palette = NULL,
  break.time.by = NULL,
  xlim = NULL,
  xscale = 1,
  xlab = "Time",
  ylab = "Strata",
  xlog = FALSE,
  legend = "top",
  legend.title = "Strata",
  legend.labs = NULL,
  y.text = TRUE,
  y.text.col = TRUE,
  fontsize = 4.5,
  font.family = "",
  axes.offset = TRUE,
  ggtheme = theme_survminer(),
  tables.theme = ggtheme,
  ...
)
Arguments
- fit
an object of class survfit. Can be a list containing two components: 1) time: time variable used in survfit; 2) table: survival table as generated by the internal function .get_timepoints_survsummary(). Can be also a simple data frame.
- data
a dataset used to fit survival curves. If not supplied then data will be extracted from 'fit' object.
- risk.table.type
risk table type. Allowed values include: "absolute" or "percentage": to show the absolute number and the percentage of subjects at risk by time, respectively. Use "abs_pct" to show both absolute number and percentage. Used only when survtable = "risk.table".
- ...
other arguments passed to the function
ggsurvtableandggpar.- survtable
a character string specifying the type of survival table to plot.
- title
the title of the plot.
- risk.table.title
The title to be used for the risk table.
- cumevents.title
The title to be used for the cumulative events table.
- cumcensor.title
The title to be used for the cumcensor table.
- color
color to be used for the survival curves.
If the number of strata/group (n.strata) = 1, the expected value is the color name. For example color = "blue".
If n.strata > 1, the expected value is the grouping variable name. By default, survival curves are colored by strata using the argument color = "strata", but you can also color survival curves by any other grouping variables used to fit the survival curves. In this case, it's possible to specify a custom color palette by using the argument palette.
- palette
the color palette to be used. Allowed values include "hue" for the default hue color scale; "grey" for grey color palettes; brewer palettes e.g. "RdBu", "Blues", ...; or custom color palette e.g. c("blue", "red"); and scientific journal palettes from ggsci R package, e.g.: "npg", "aaas", "lancet", "jco", "ucscgb", "uchicago", "simpsons" and "rickandmorty". See details section for more information. Can be also a numeric vector of length(groups); in this case a basic color palette is created using the function palette.
- break.time.by
numeric value controlling time axis breaks. Default value is NULL.
- xlim
x axis limits e.g.
xlim = c(0, 1000).- xscale
numeric or character value specifying x-axis scale.
If numeric, the value is used to divide the labels on the x axis. For example, a value of 365.25 will give labels in years instead of the original days.
If character, allowed options include one of c("d_m", "d_y", "m_d", "m_y", "y_d", "y_m"), where d = days, m = months and y = years. For example, xscale = "d_m" will transform labels from days to months; xscale = "m_y", will transform labels from months to years.
- xlab
x axis label
- ylab
y axis label
- xlog
logical value. If TRUE, x axis is tansformed into log scale.
- legend
character specifying legend position. Allowed values are one of c("top", "bottom", "left", "right", "none"). Default is "top" side position. to remove the legend use legend = "none". Legend position can be also specified using a numeric vector c(x, y); see details section.
- legend.title
legend title.
- legend.labs
character vector specifying legend labels. Used to replace the names of the strata from the fit. Should be given in the same order as those strata.
- y.text
logical. Default is TRUE. If FALSE, the table y axis tick labels will be hidden.
- y.text.col
logical. Default value is FALSE. If TRUE, the table tick labels will be colored by strata.
- fontsize
text font size.
- font.family
character vector specifying text element font family, e.g.: font.family = "Courier New".
- axes.offset
logical value. Default is TRUE. If FALSE, set the plot axes to start at the origin.
- ggtheme
function, ggplot2 theme name. Default value is theme_survminer. Allowed values include ggplot2 official themes: see
theme.- tables.theme
function, ggplot2 theme name. Default value is theme_survminer. Allowed values include ggplot2 official themes: see
theme. Note that,tables.themeis incremental toggtheme.
Functions
ggrisktable(): Plot the number at risk table.ggcumevents(): Plot the cumulative number of events tableggcumcensor(): Plot the cumulative number of censor tableggsurvtable(): Generic function to plot survival tables: risk.table, cumevents and cumcensor
Author
Alboukadel Kassambara, alboukadel.kassambara@gmail.com
Examples
# Fit survival curves
#:::::::::::::::::::::::::::::::::::::::::::::::
require("survival")
fit<- survfit(Surv(time, status) ~ sex, data = lung)
# Survival tables
#:::::::::::::::::::::::::::::::::::::::::::::::
tables <- ggsurvtable(fit, data = lung, color = "strata",
y.text = FALSE)
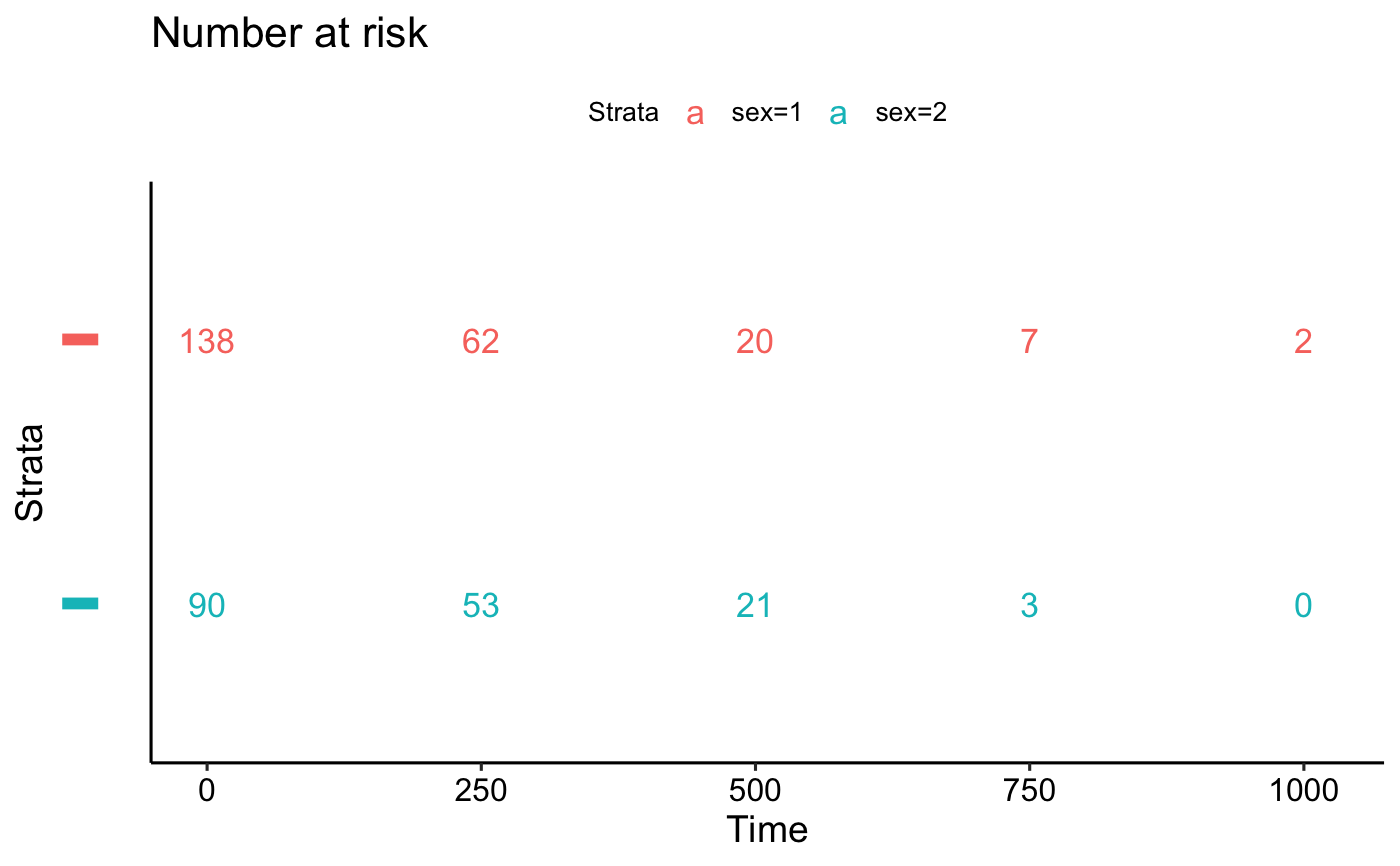
# Risk table
tables$risk.table
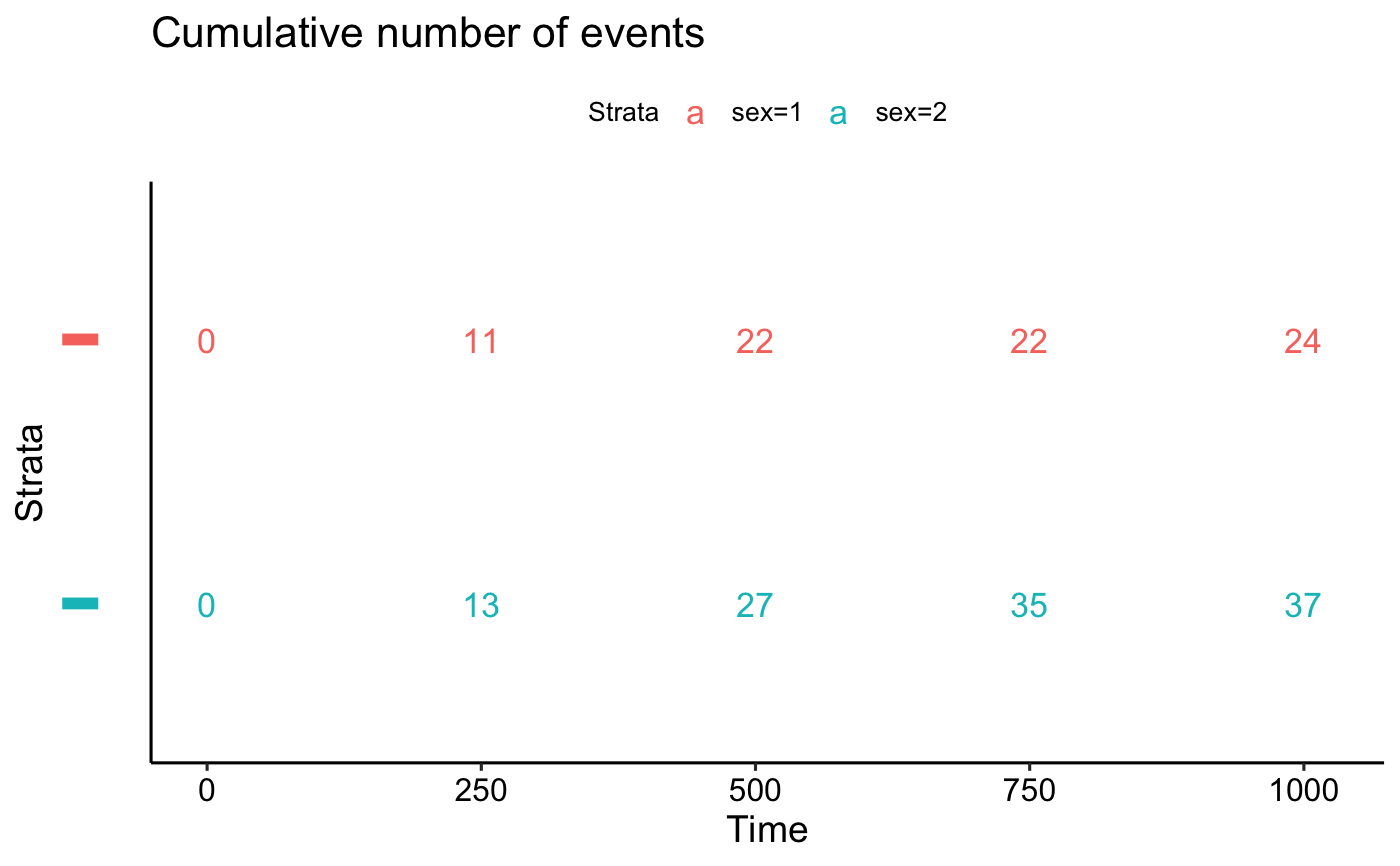
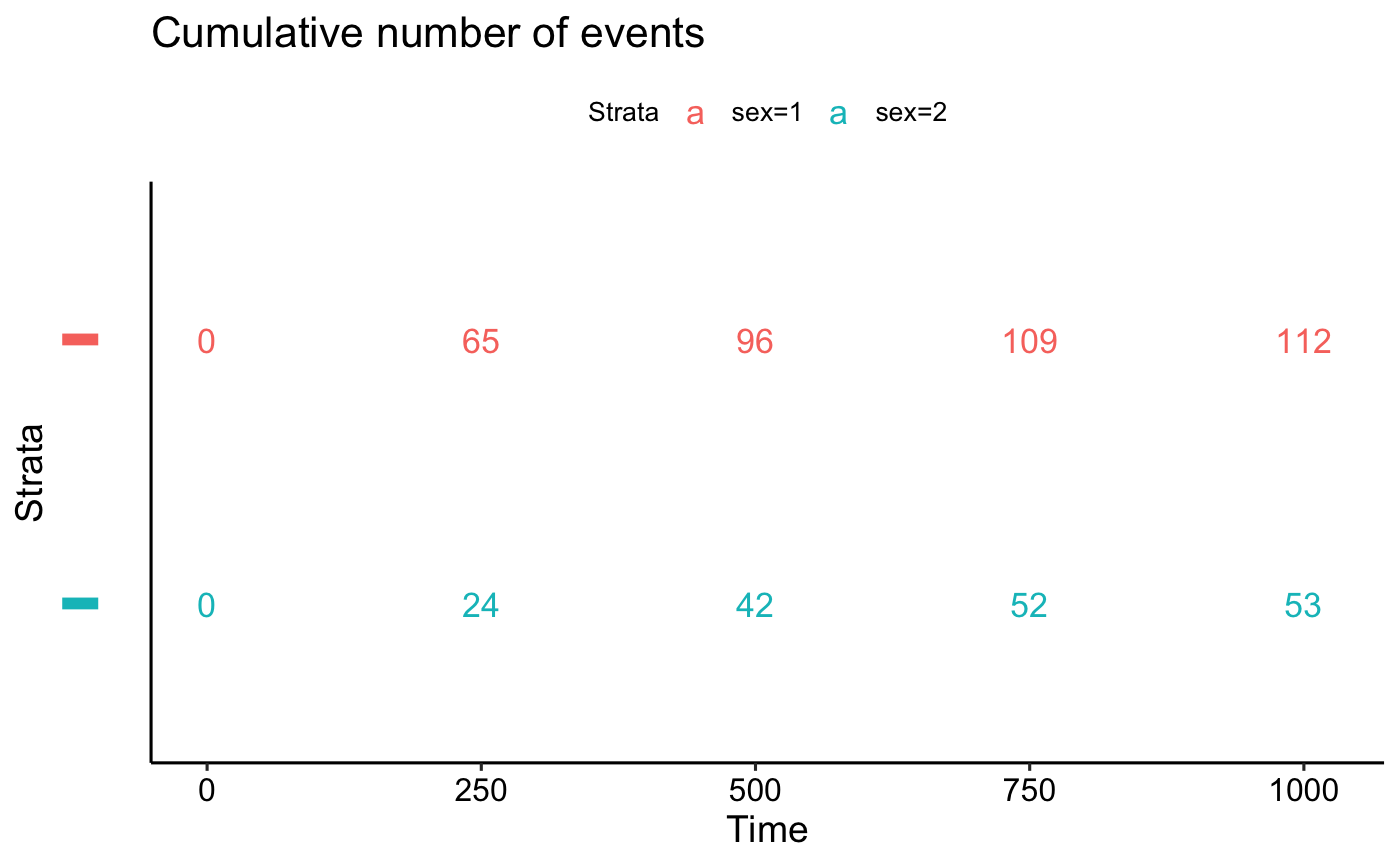
 # Number of cumulative events
tables$cumevents
# Number of cumulative events
tables$cumevents
 # Number of cumulative censoring
tables$cumcensor
# Number of cumulative censoring
tables$cumcensor