Clustering methods classify data samples into groups of similar objects. This process requires some methods for measuring the distance or the (dis)similarity between the observations. Read more: Clustering Distance Measures in R.
get_dist(): Computes a distance matrix between the rows of a data matrix. Compared to the standard
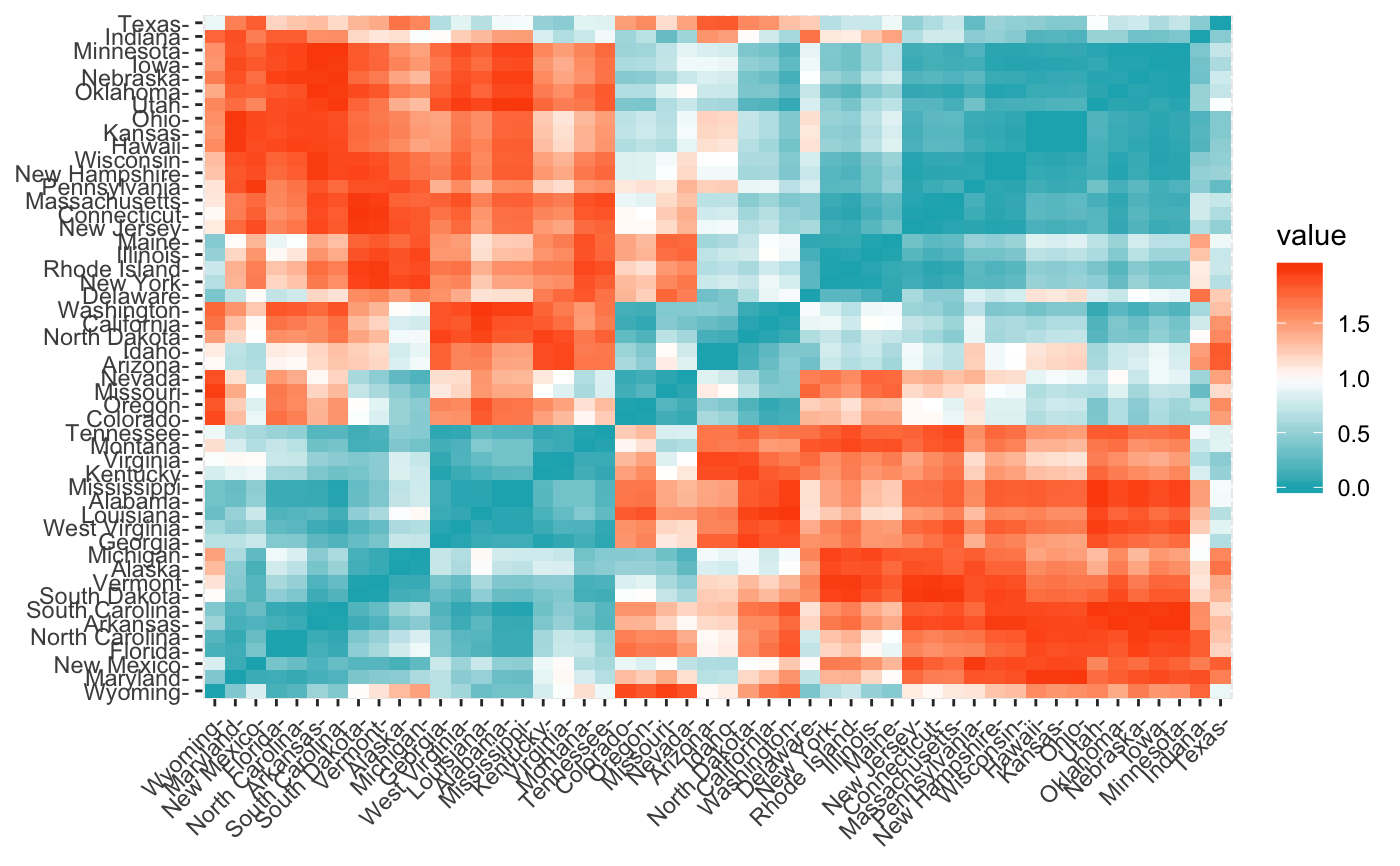
dist() function, it supports correlation-based distance measures including "pearson", "kendall" and "spearman" methods.fviz_dist(): Visualizes a distance matrix
When stand = TRUE, scaling that produces non-finite values is
rejected. fviz_dist() also validates that supplied distance objects
contain only finite values before plotting.
Usage
get_dist(x, method = "euclidean", stand = FALSE, ...)

fviz_dist(
  dist.obj,
  order = TRUE,
  show_labels = TRUE,
  lab_size = NULL,
  gradient = list(low = "red", mid = "white", high = "blue")
)
Arguments
- x
a numeric matrix or a data frame.
- method
the distance measure to be used. This must be one of "euclidean", "maximum", "manhattan", "canberra", "binary", "minkowski", "pearson", "spearman" or "kendall".
- stand
logical value; default is FALSE. If TRUE, then the data will be standardized using the function
scale(). Measurements are standardized for each variable (column), by subtracting the variable's mean value and dividing by the variable's standard deviation. If scaling producesNAvalues,get_dist()stops with a package-level error.- ...
other arguments to be passed to the function dist() when using get_dist().
- dist.obj
an object of class "dist" as generated by the function
dist()orget_dist(), containing only finite dissimilarity values.- order
logical value. if TRUE the ordered dissimilarity image (ODI) is shown.
- show_labels
logical value. If TRUE, the labels are displayed.
- lab_size
the size of labels.
- gradient
a list containing three elements specifying the colors for low, mid and high values in the ordered dissimilarity image. The element "mid" can take the value of NULL.
See also
dist.
Online tutorial: Clustering Distance Measures in R.
Author
Alboukadel Kassambara alboukadel.kassambara@gmail.com