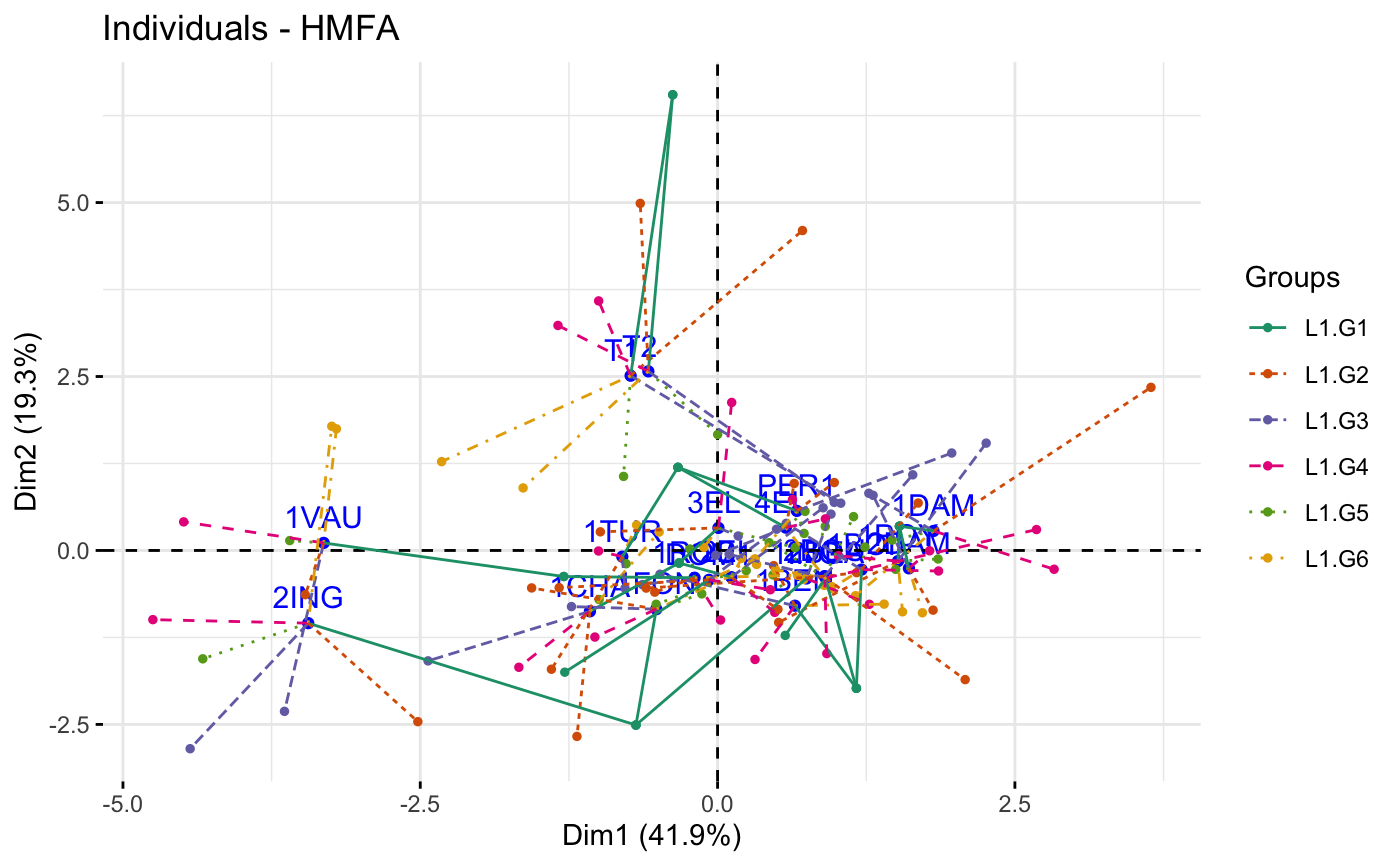
Hierarchical Multiple Factor Analysis (HMFA) is an extension of
MFA, used in a situation where the data are organized into a hierarchical
structure. fviz_hmfa() provides ggplot2-based elegant visualization of HMFA
outputs from the R function: HMFA [FactoMineR].
fviz_hmfa_ind(): Graph of individuals
fviz_hmfa_var(): Graph of variables
fviz_hmfa_quali_biplot(): Biplot of individuals and qualitative variables
fviz_hmfa(): An alias of fviz_hmfa_ind()
Read more: Multiple Factor Analysis (MFA) in R: Analyze Groups of Variables.
Usage
fviz_hmfa_ind(
  X,
  axes = c(1, 2),
  geom = c("point", "text"),
  repel = FALSE,
  habillage = "none",
  addEllipses = FALSE,
  shape.ind = 19,
  col.ind = "blue",
  col.ind.sup = "darkblue",
  alpha.ind = 1,
  select.ind = list(name = NULL, cos2 = NULL, contrib = NULL),
  partial = NULL,
  col.partial = "group",
  group.names = NULL,
  node.level = 1,
  ...
)

fviz_hmfa_var(
  X,
  choice = c("quanti.var", "quali.var", "group"),
  axes = c(1, 2),
  geom = c("point", "text"),
  repel = FALSE,
  col.var = "red",
  alpha.var = 1,
  shape.var = 17,
  col.var.sup = "darkgreen",
  select.var = list(name = NULL, cos2 = NULL, contrib = NULL),
  ...
)

fviz_hmfa_quali_biplot(
  X,
  axes = c(1, 2),
  geom = c("point", "text"),
  repel = FALSE,
  habillage = "none",
  title = "Biplot of individuals and qualitative variables - HMFA",
  ...
)

fviz_hmfa(X, ...)
Arguments
- X
an object of class HMFA [FactoMineR].
- axes
a numeric vector of length 2 specifying the dimensions to be plotted.
- geom
a text specifying the geometry to be used for the graph. Allowed values are the combination of
c("point", "arrow", "text"). Use"point"(to show only points);"text"to show only labels;c("point", "text")orc("arrow", "text")to show arrows and texts. Usingc("arrow", "text")is sensible only for the graph of variables.- repel
logical; whether to use ggrepel to avoid overplotting text labels. The old
jitterargument is kept for backward compatibility and is converted torepel = TRUEwith a deprecation warning.- habillage
an optional factor variable for coloring the observations by groups. Default value is "none". If X is an HMFA object from FactoMineR package, habillage can also specify the index of the factor variable in the data.
- addEllipses
logical value. If TRUE, draws ellipses around the individuals when habillage != "none".
- shape.ind, shape.var
point shapes of individuals and variables, respectively.
- col.ind, col.var
color for individuals, partial individuals and variables, respectively. Can be a continuous variable or a factor variable. Possible values also include "cos2", "contrib", "coord", "x", and "y". In this case, the colors for individuals/variables are automatically controlled by their qualities ("cos2"), contributions ("contrib"), coordinates (x^2 + y^2 , "coord"), x values("x") or y values("y"). To use automatic coloring (by cos2, contrib, ....), make sure that habillage ="none".
- col.ind.sup
color for supplementary individuals
- alpha.ind, alpha.var
controls the transparency of individual, partial individual and variable, respectively. The value can vary from 0 (total transparency) to 1 (no transparency). Default value is 1. Possible values also include "cos2", "contrib", "coord", "x", and "y". In this case, the transparency for individual/variable colors are automatically controlled by their qualities ("cos2"), contributions ("contrib"), coordinates (x^2 + y^2 , "coord"), x values("x") or y values("y"). To use this, make sure that habillage ="none".
- select.ind, select.var
a selection of individuals and variables to be drawn. Allowed values are NULL or a list containing the arguments name, cos2 or contrib:
name is a character vector containing individuals/variables to be drawn
cos2 if cos2 is in [0, 1], ex: 0.6, then individuals/variables with a cos2 > 0.6 are drawn. if cos2 > 1, ex: 5, then the top 5 individuals/variables with the highest cos2 are drawn.
contrib if contrib > 1, ex: 5, then the top 5 individuals/variables with the highest contributions are drawn
union: logical. When several of name/cos2/contrib are given, FALSE (default) combines them with AND (each condition further narrows the selection); TRUE combines them with OR (an element is kept if it matches any condition), e.g. named items plus the top-cos2 ones.
- partial
list of the individuals for which the partial points should be drawn. (by default, partial = NULL and no partial points are drawn). Use partial = "all" to visualize partial points for all individuals.
- col.partial
color for partial individuals. By default, points are colored according to the groups.
- group.names
a vector containing the name of the groups (by default, NULL and the groups are named group.1, group.2, and so on).
- node.level
a single number indicating the HMFA node level to plot.
- ...
Arguments to be passed to the function fviz() and ggpubr::ggpar()
- choice
the graph to plot. Allowed values include one of c("quanti.var", "quali.var", "group") for plotting quantitative variables, qualitative variables and group of variables, respectively.
- col.var.sup
color for supplementary variables.
- title
the title of the graph
See also
get_hmfa, fviz_mfa.
Online tutorial: Multiple Factor Analysis (MFA) in R: Analyze Groups of Variables.
Examples
# Hierarchical Multiple Factor Analysis
# ++++++++++++++++++++++++
# Install and load FactoMineR to compute MFA
# install.packages("FactoMineR")
library("FactoMineR")
data(wine)
hierar <- list(c(2,5,3,10,9,2), c(4,2))
res.hmfa <- HMFA(wine, H = hierar, type=c("n",rep("s",5)), graph = FALSE)
# Graph of individuals
# ++++++++++++++++++++
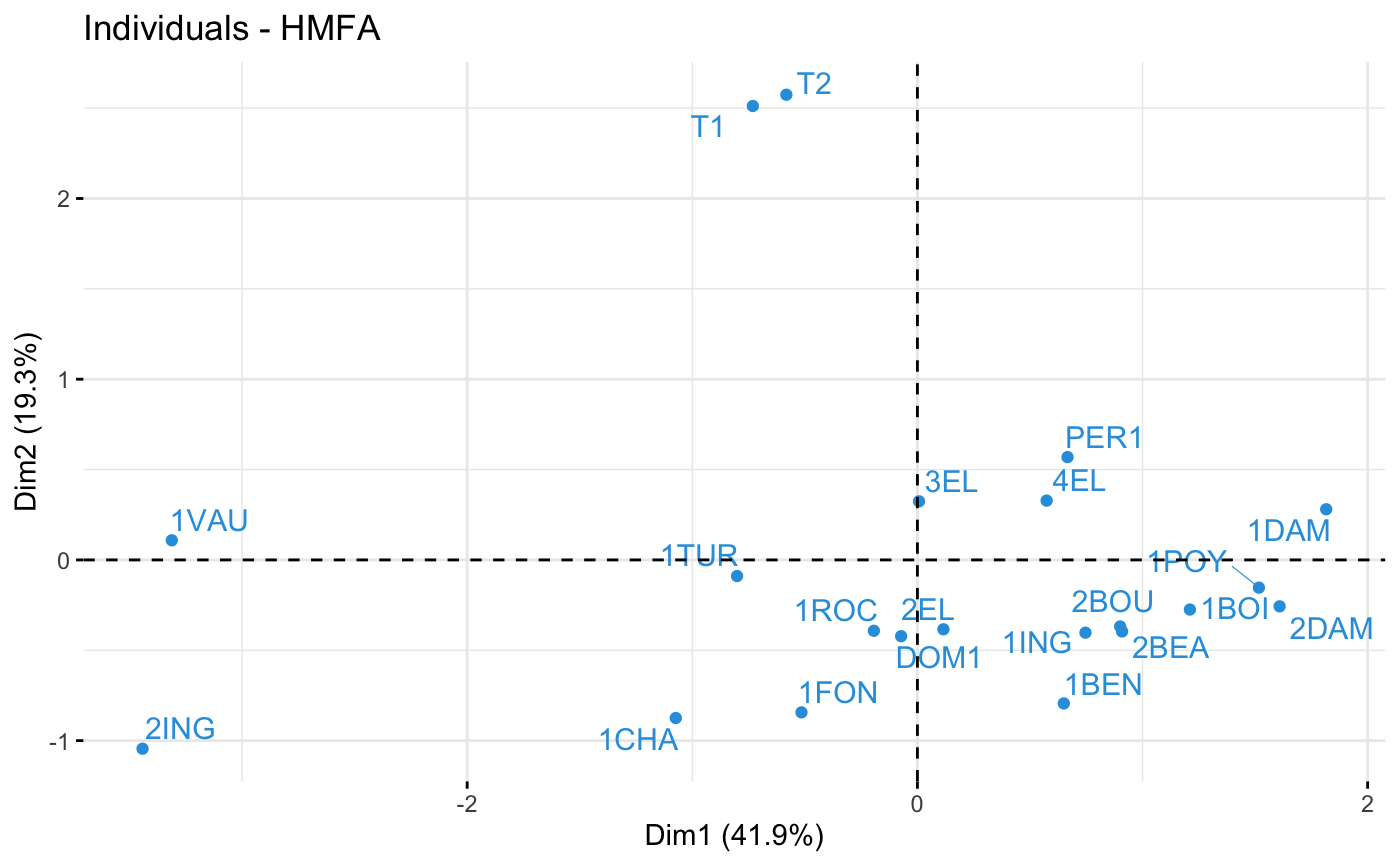
# Color of individuals: col.ind = "#2E9FDF"
# Use repel = TRUE to avoid overplotting (slow if many points)
fviz_hmfa_ind(res.hmfa, repel = TRUE, col.ind = "#2E9FDF")
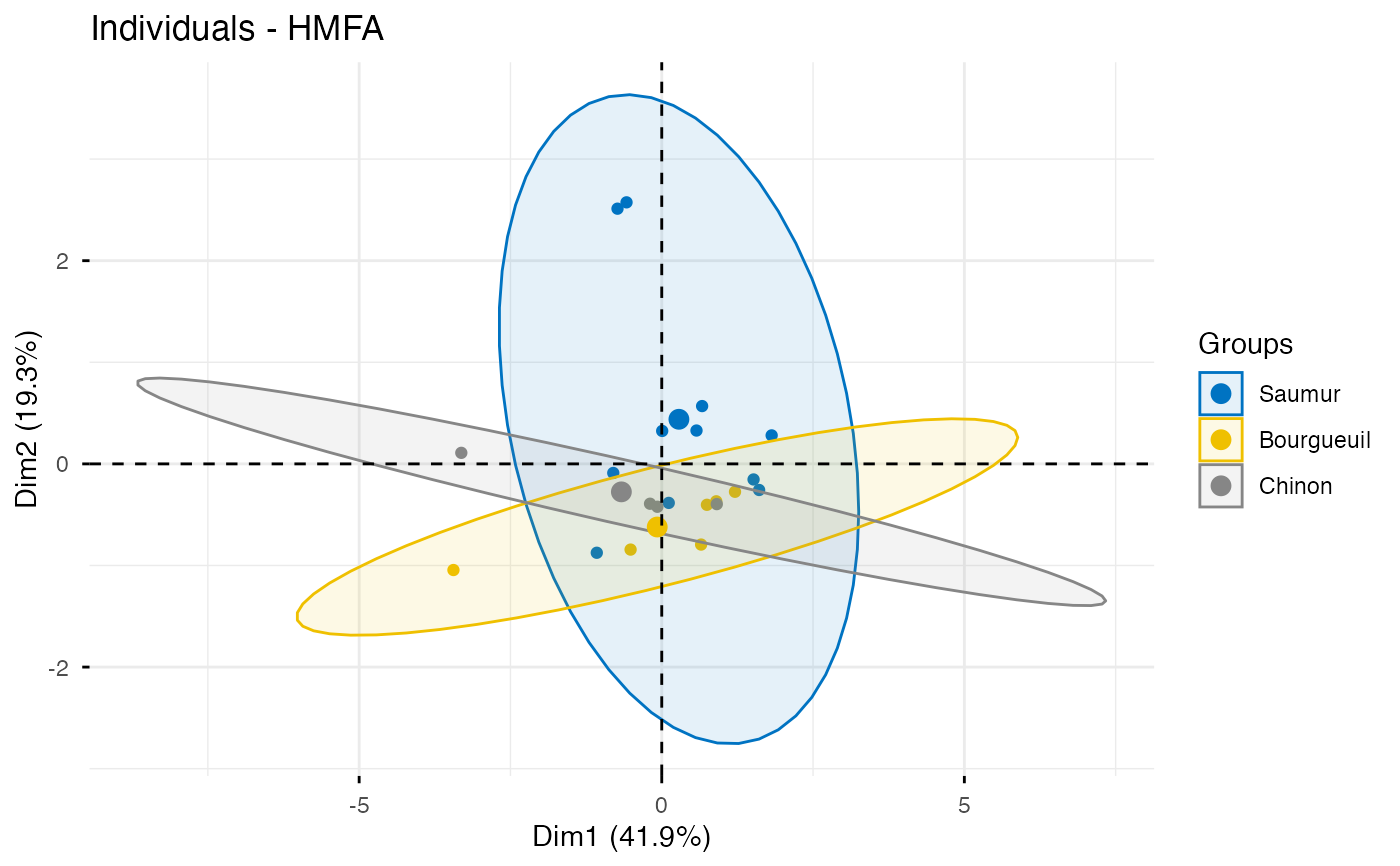
 # Color individuals by groups, add concentration ellipses
# Remove labels: label = "none".
# Change color palette to "jco". See ?ggpubr::ggpar
grp <- as.factor(wine[,1])
p <- fviz_hmfa_ind(res.hmfa, label="none", habillage=grp,
addEllipses=TRUE, palette = "jco")
print(p)
# Color individuals by groups, add concentration ellipses
# Remove labels: label = "none".
# Change color palette to "jco". See ?ggpubr::ggpar
grp <- as.factor(wine[,1])
p <- fviz_hmfa_ind(res.hmfa, label="none", habillage=grp,
addEllipses=TRUE, palette = "jco")
print(p)
 # Graph of variables
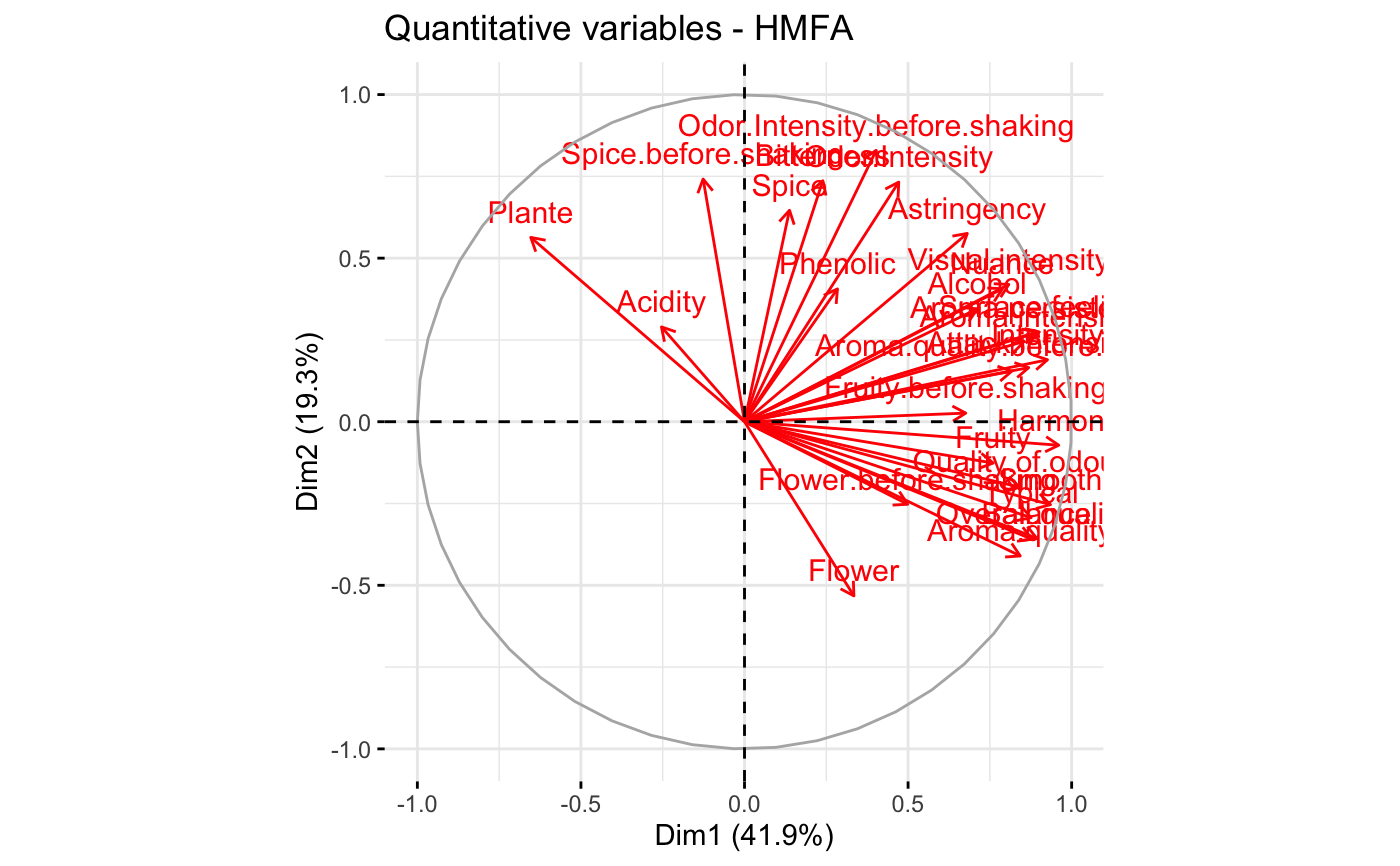
# ++++++++++++++++++++++++++++++++++++++++
# Quantitative variables
fviz_hmfa_var(res.hmfa, "quanti.var")
# Graph of variables
# ++++++++++++++++++++++++++++++++++++++++
# Quantitative variables
fviz_hmfa_var(res.hmfa, "quanti.var")
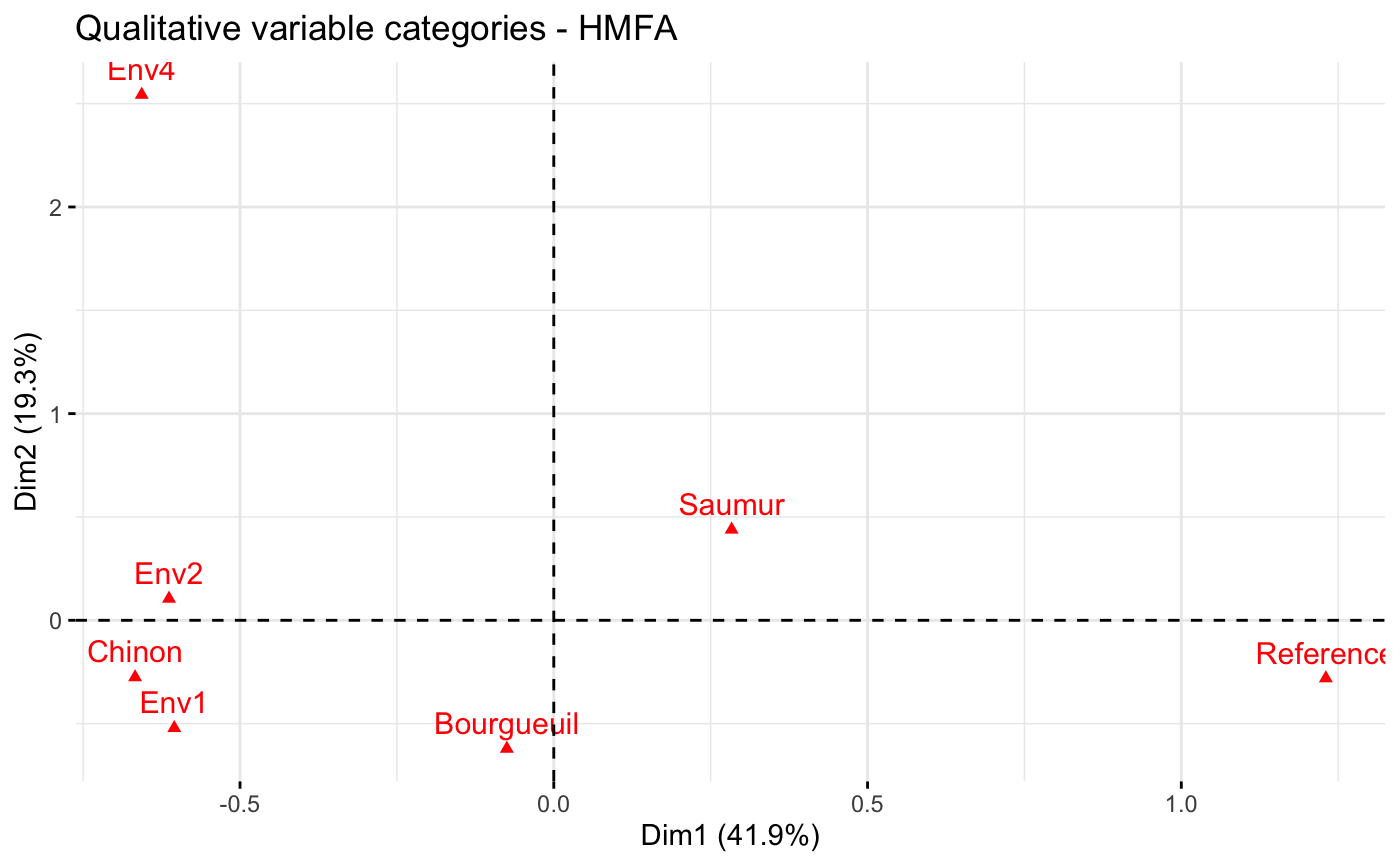
 # Graph of categorical variable categories
fviz_hmfa_var(res.hmfa, "quali.var")
# Graph of categorical variable categories
fviz_hmfa_var(res.hmfa, "quali.var")
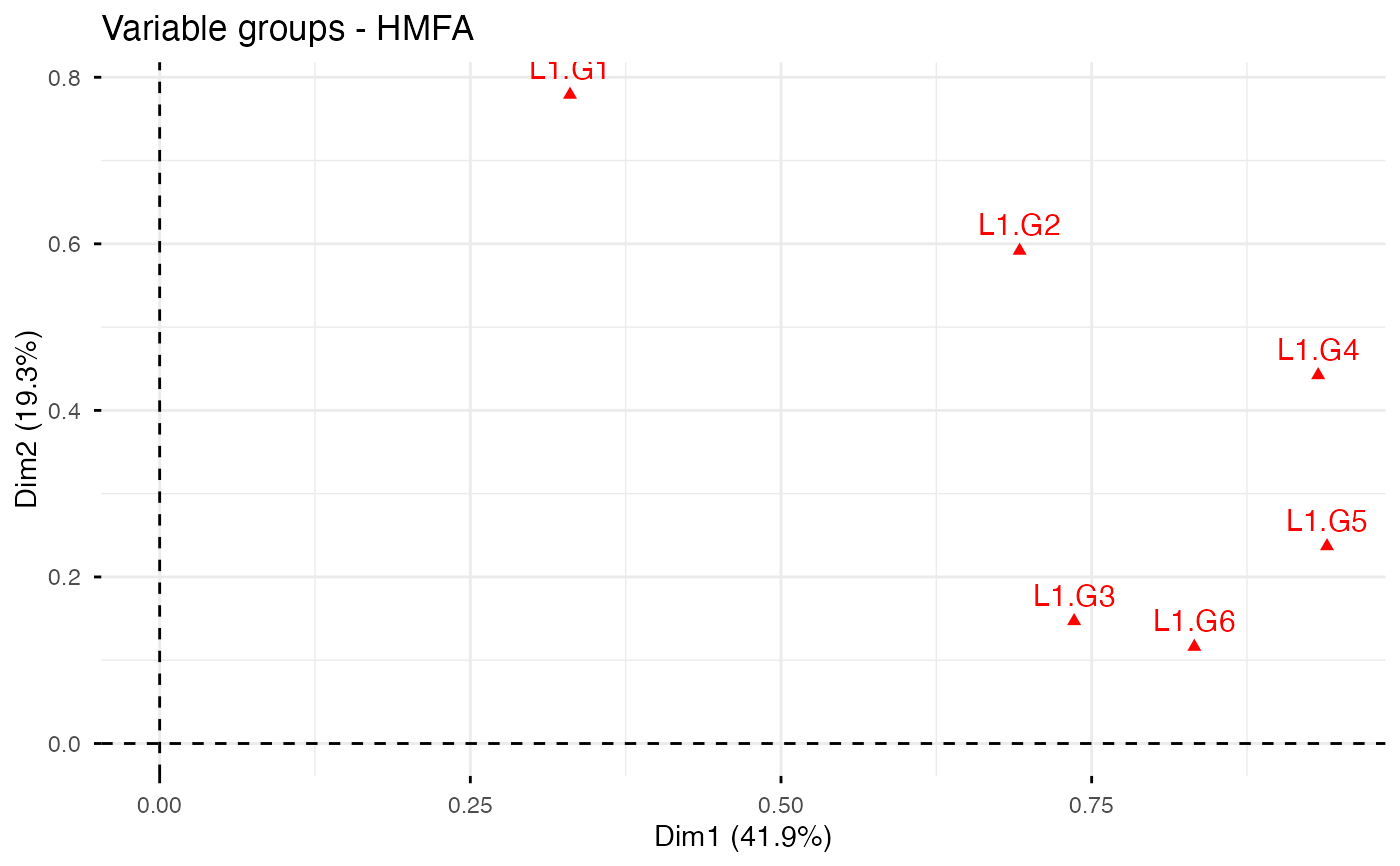
 # Groups of variables (correlation square)
fviz_hmfa_var(res.hmfa, "group")
# Groups of variables (correlation square)
fviz_hmfa_var(res.hmfa, "group")
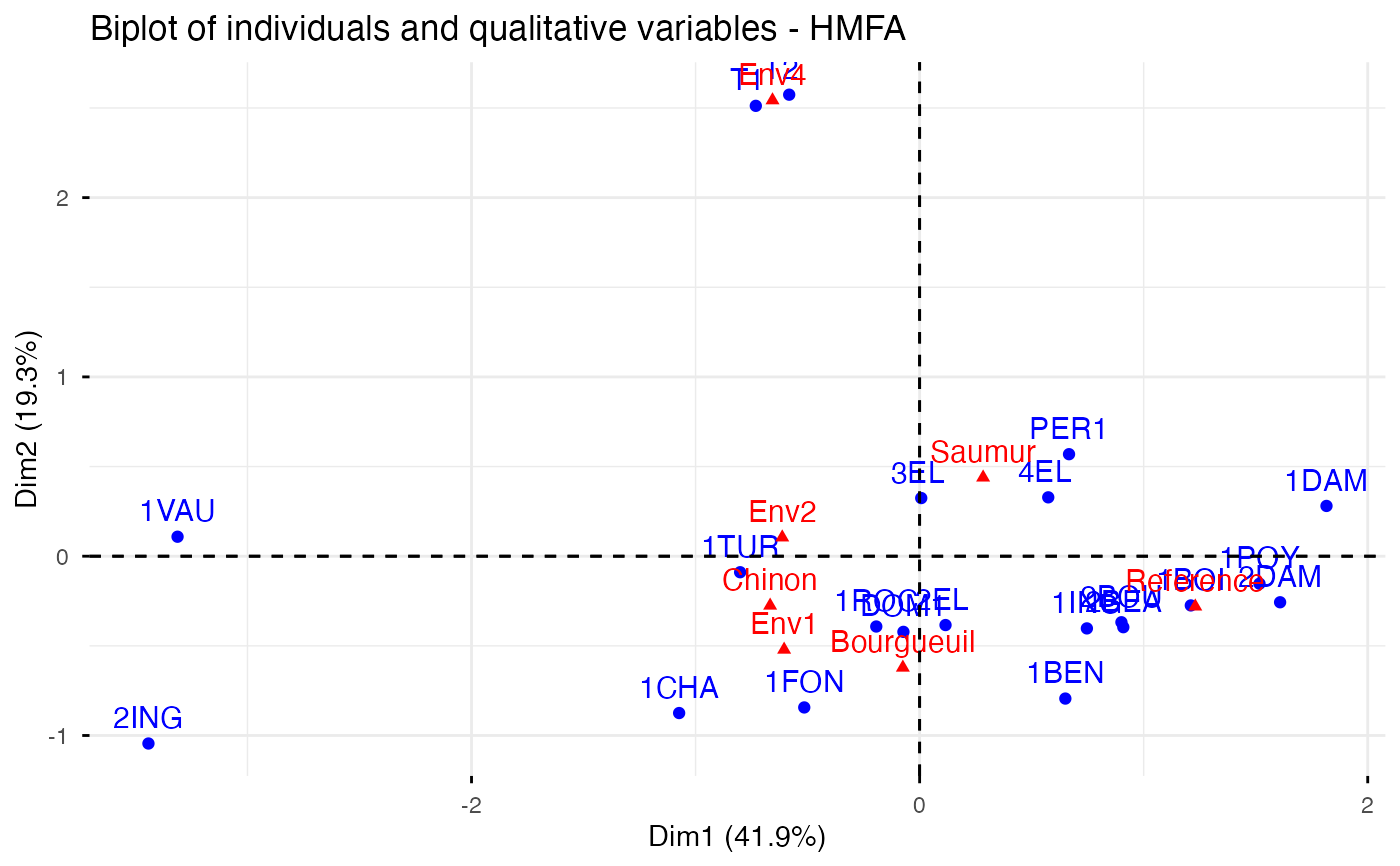
 # Biplot of categorical variable categories and individuals
# +++++++++++++++++++++++++++++++++++++++++++++++++++++++++
fviz_hmfa_quali_biplot(res.hmfa)
# Biplot of categorical variable categories and individuals
# +++++++++++++++++++++++++++++++++++++++++++++++++++++++++
fviz_hmfa_quali_biplot(res.hmfa)
 # Graph of partial individuals (starplot)
# +++++++++++++++++++++++++++++++++++++++
fviz_hmfa_ind(res.hmfa, partial = "all", col.partial = "black")
#> Ignoring unknown labels:
#> • colour : "Groups"
# Graph of partial individuals (starplot)
# +++++++++++++++++++++++++++++++++++++++
fviz_hmfa_ind(res.hmfa, partial = "all", col.partial = "black")
#> Ignoring unknown labels:
#> • colour : "Groups"