Transform the output of
arrangeGrob() and
grid.arrange() to a an object of class
ggplot.
as_ggplot(x)Arguments
- x
an object of class gtable or grob as returned by the functions
arrangeGrob()andgrid.arrange().
Value
an object of class ggplot.
Examples
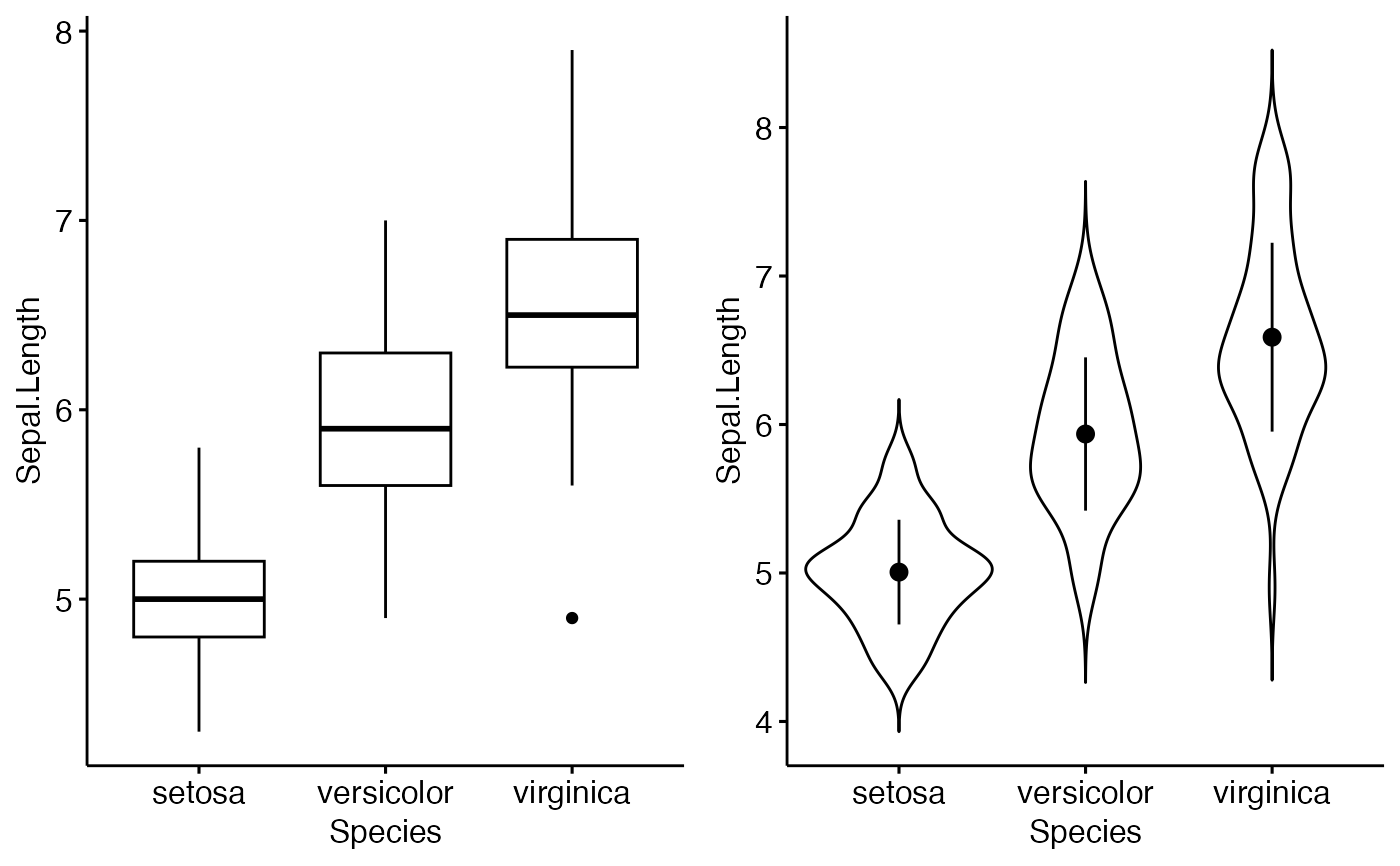
# Creat some plots
bxp <- ggboxplot(iris, x = "Species", y = "Sepal.Length")
vp <- ggviolin(iris, x = "Species", y = "Sepal.Length",
              add = "mean_sd")

# Arrange the plots in one page
# Returns a gtable (grob) object
library(gridExtra)
gt <- arrangeGrob(bxp, vp, ncol = 2)

# Transform to a ggplot and print
as_ggplot(gt)