R/rotate.R
rotate.Rd
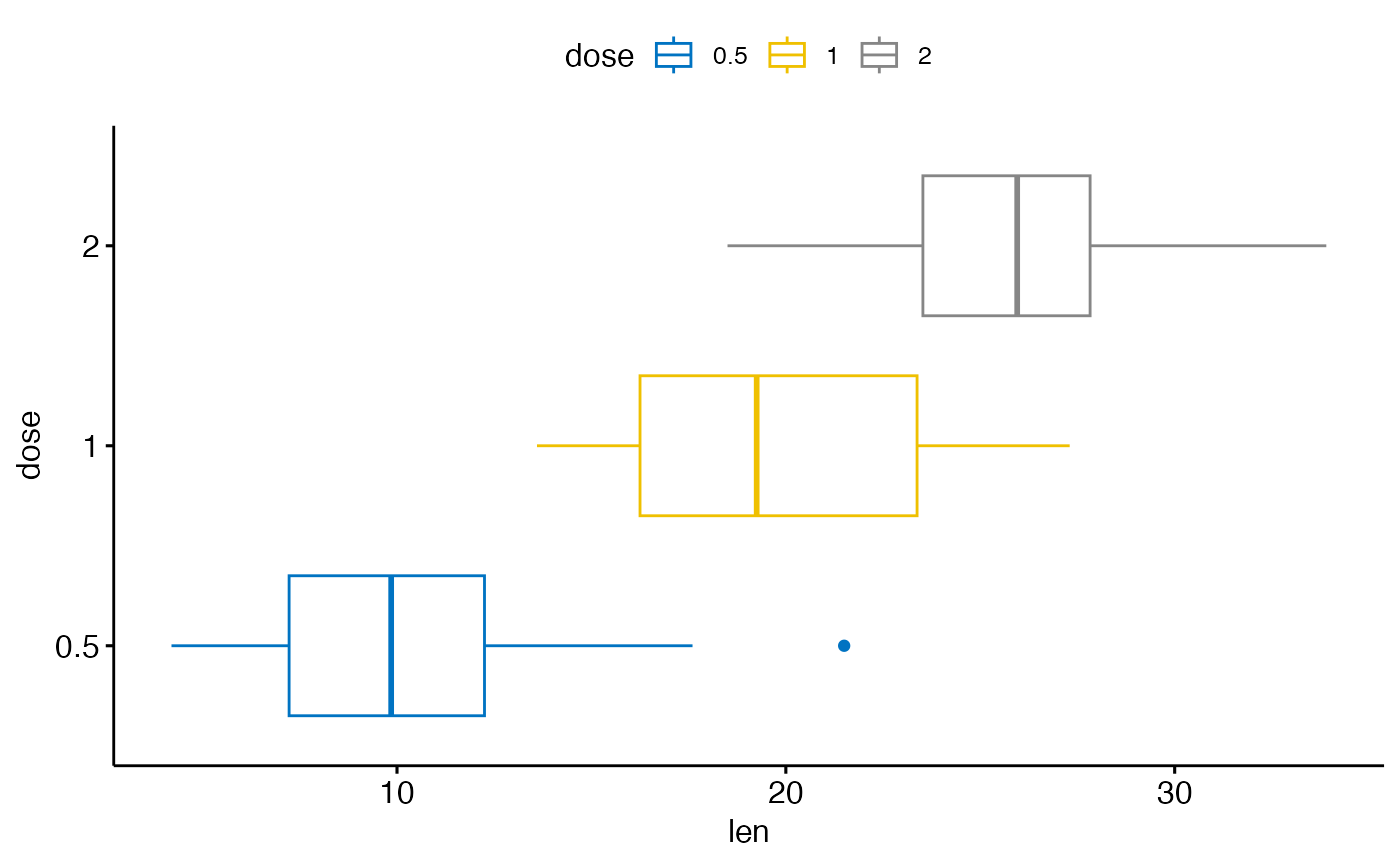
Rotate a ggplot to create horizontal plots. Wrapper around coord_flip.
coord_flip
rotate(...)
other arguments to pass to coord_flip.
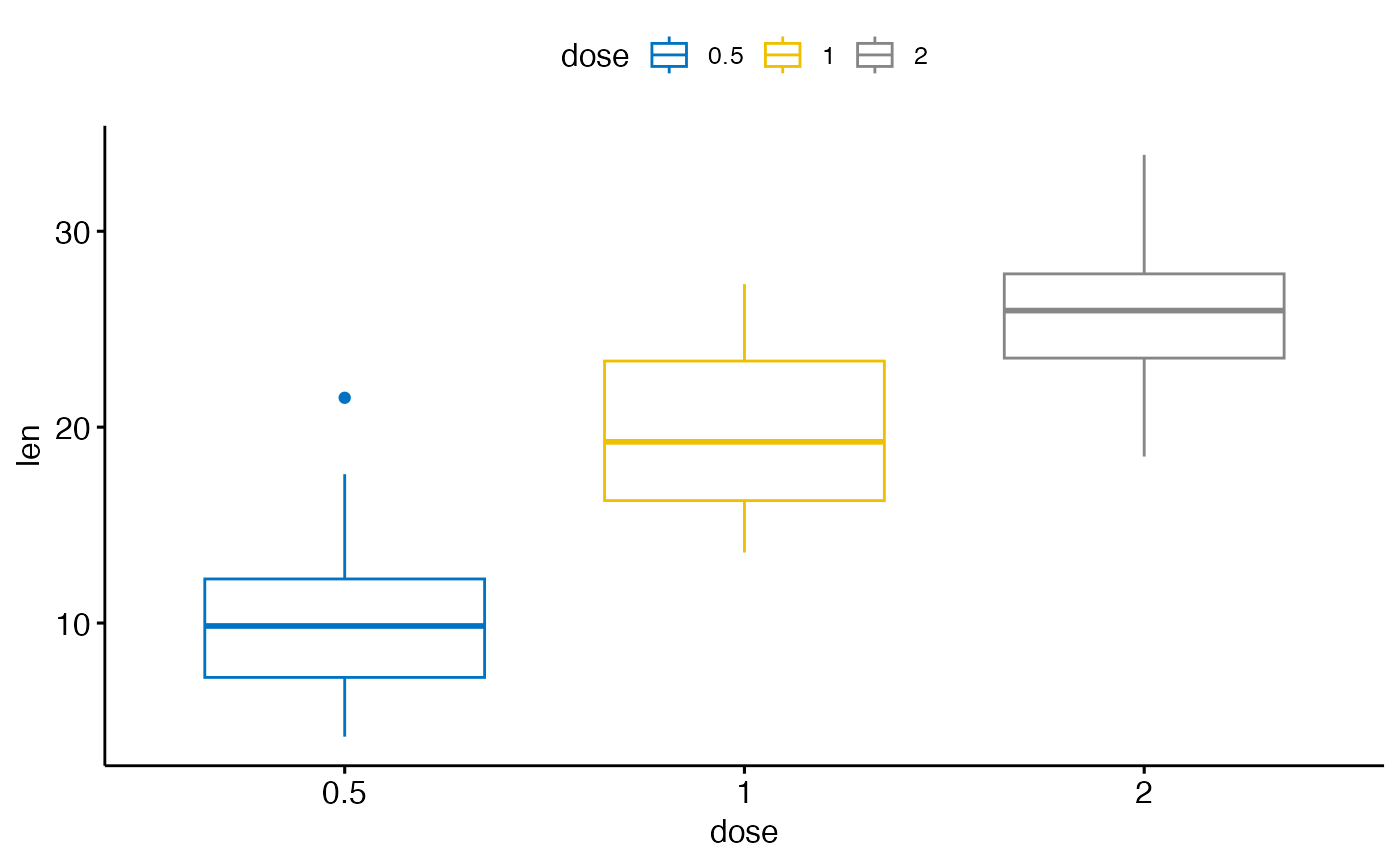
# Load data
data("ToothGrowth")
df <- ToothGrowth

# Basic plot
p <- ggboxplot(df,
  x = "dose", y = "len",
  color = "dose", palette = "jco"
)
p

# Create horizontal plots
p + rotate()