Add Central Tendency Measures to a GGPLot
Source:R/stat_central_tendency.R
stat_central_tendency.RdAdd central tendency measures (mean, median, mode) to density and histogram plots created using ggplots.
Note that, normally, the mode is used for categorical data where we wish to know which is the most common category. Therefore, we can have have two or more values that share the highest frequency. This might be problematic for continuous variable.
For continuous variable, we can consider using mean or median as the measures of the central tendency.
Arguments
- mapping
Set of aesthetic mappings created by
aes(). If specified andinherit.aes = TRUE(the default), it is combined with the default mapping at the top level of the plot. You must supplymappingif there is no plot mapping.- data
The data to be displayed in this layer. There are three options:
If
NULL, the default, the data is inherited from the plot data as specified in the call toggplot().A
data.frame, or other object, will override the plot data. All objects will be fortified to produce a data frame. Seefortify()for which variables will be created.A
functionwill be called with a single argument, the plot data. The return value must be adata.frame, and will be used as the layer data. Afunctioncan be created from aformula(e.g.~ head(.x, 10)).- geom
The geometric object to use to display the data for this layer. When using a
stat_*()function to construct a layer, thegeomargument can be used to override the default coupling between stats and geoms. Thegeomargument accepts the following:A
Geomggproto subclass, for exampleGeomPoint.A string naming the geom. To give the geom as a string, strip the function name of the
geom_prefix. For example, to usegeom_point(), give the geom as"point".For more information and other ways to specify the geom, see the layer geom documentation.
- position
A position adjustment to use on the data for this layer. This can be used in various ways, including to prevent overplotting and improving the display. The
positionargument accepts the following:The result of calling a position function, such as
position_jitter(). This method allows for passing extra arguments to the position.A string naming the position adjustment. To give the position as a string, strip the function name of the
position_prefix. For example, to useposition_jitter(), give the position as"jitter".For more information and other ways to specify the position, see the layer position documentation.
- na.rm
If FALSE (the default), removes missing values with a warning. If TRUE silently removes missing values.
- show.legend
logical. Should this layer be included in the legends?
NA, the default, includes if any aesthetics are mapped.FALSEnever includes, andTRUEalways includes. It can also be a named logical vector to finely select the aesthetics to display. To include legend keys for all levels, even when no data exists, useTRUE. IfNA, all levels are shown in legend, but unobserved levels are omitted.- inherit.aes
If
FALSE(the default for most ggpubr functions), overrides the default aesthetics, rather than combining with them. This is most useful for helper functions that define both data and aesthetics and shouldn't inherit behaviour from the default plot specification. Set toTRUEto inherit aesthetics from the parent ggplot layer.- type
the type of central tendency measure to be used. Possible values include:
"mean", "median", "mode".- ...
other arguments to pass to
geom_line.
See also
Examples
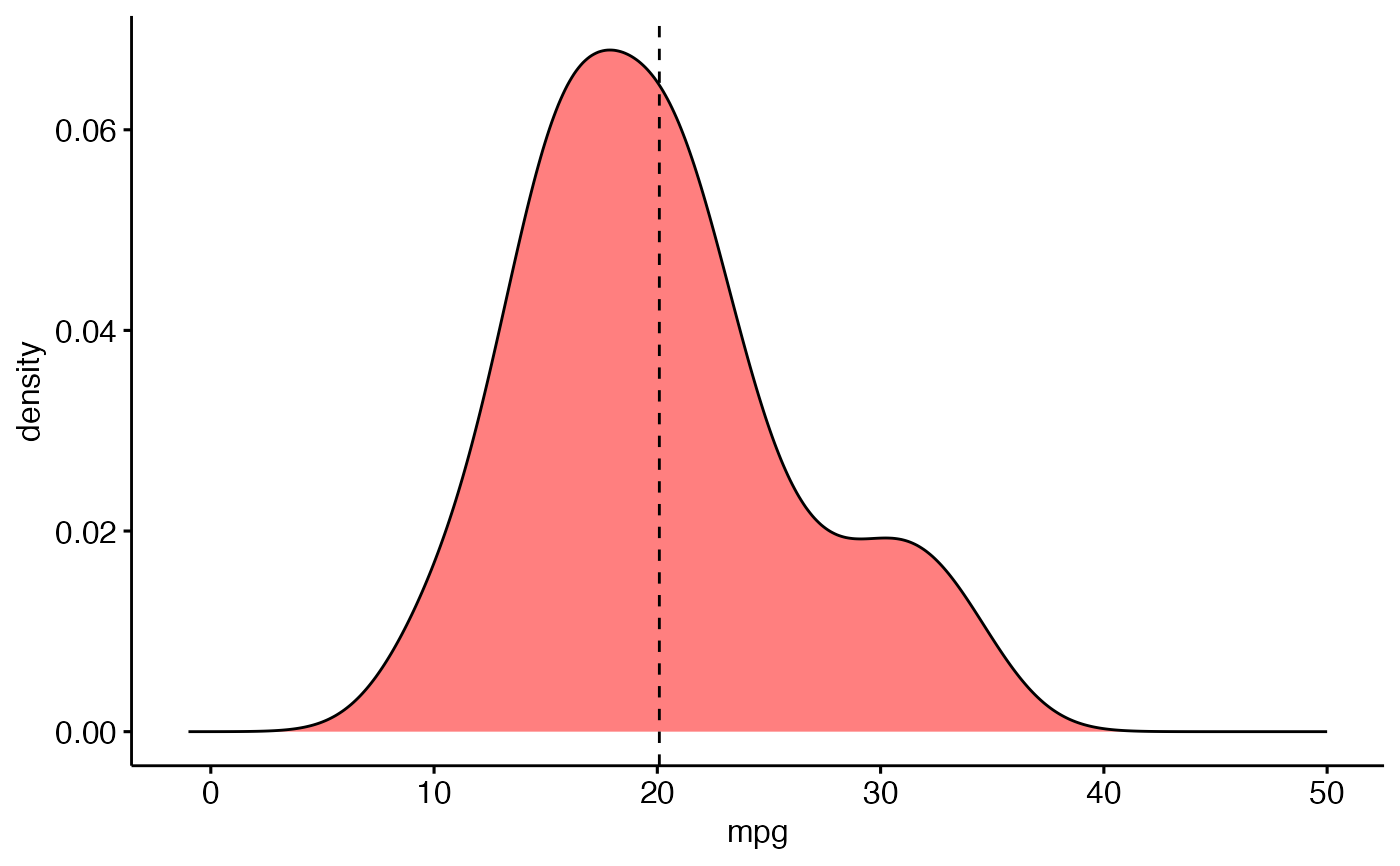
# Simple density plot
data("mtcars")
ggdensity(mtcars, x = "mpg", fill = "red") +
scale_x_continuous(limits = c(-1, 50)) +
stat_central_tendency(type = "mean", linetype = "dashed")
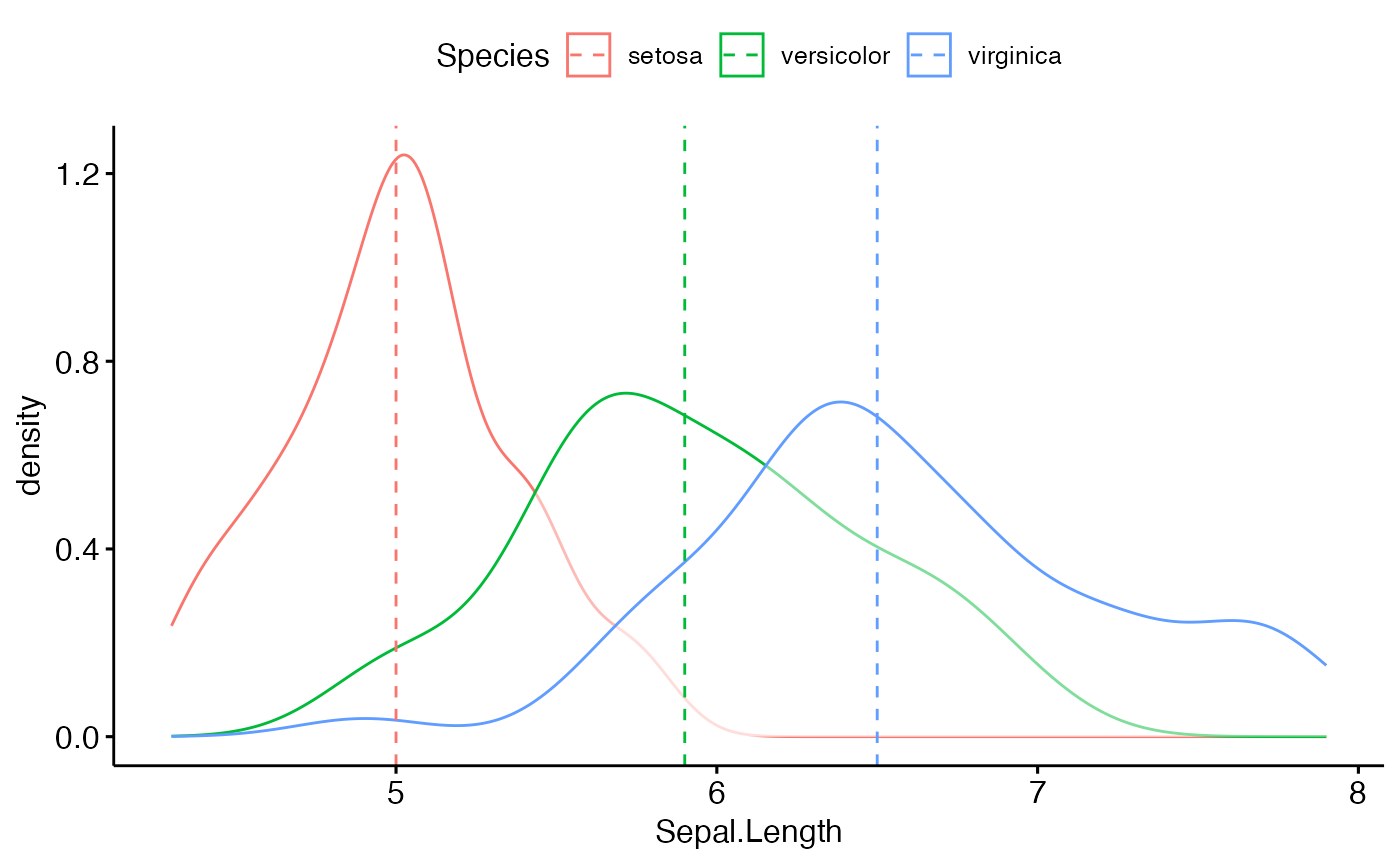
 # Color by groups
data(iris)
ggdensity(iris, "Sepal.Length", color = "Species") +
stat_central_tendency(aes(color = Species), type = "median", linetype = 2)
# Color by groups
data(iris)
ggdensity(iris, "Sepal.Length", color = "Species") +
stat_central_tendency(aes(color = Species), type = "median", linetype = 2)
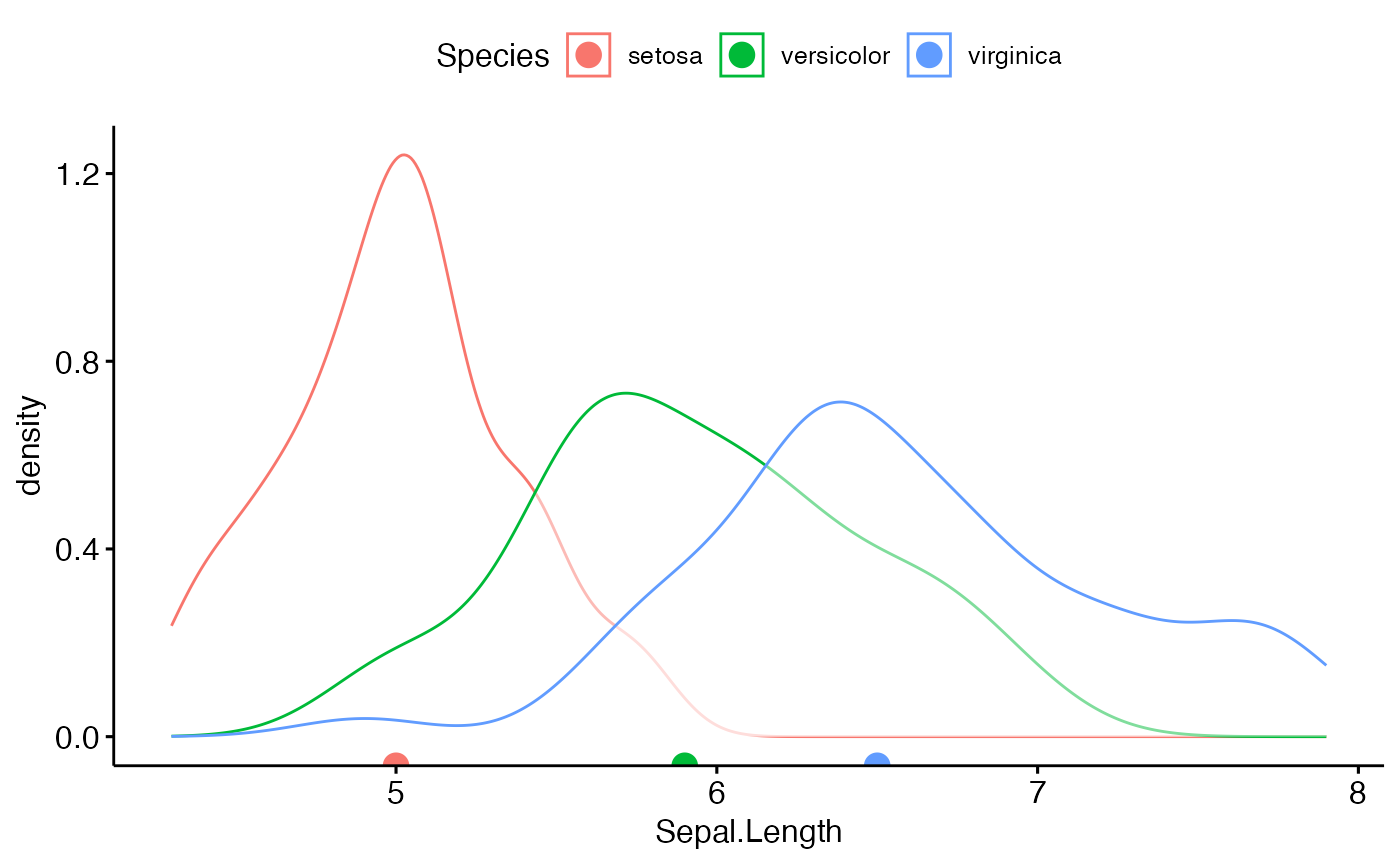
 # Use geom = "point" for central tendency
data(iris)
ggdensity(iris, "Sepal.Length", color = "Species") +
stat_central_tendency(
aes(color = Species), type = "median",
geom = "point", size = 4
)
# Use geom = "point" for central tendency
data(iris)
ggdensity(iris, "Sepal.Length", color = "Species") +
stat_central_tendency(
aes(color = Species), type = "median",
geom = "point", size = 4
)
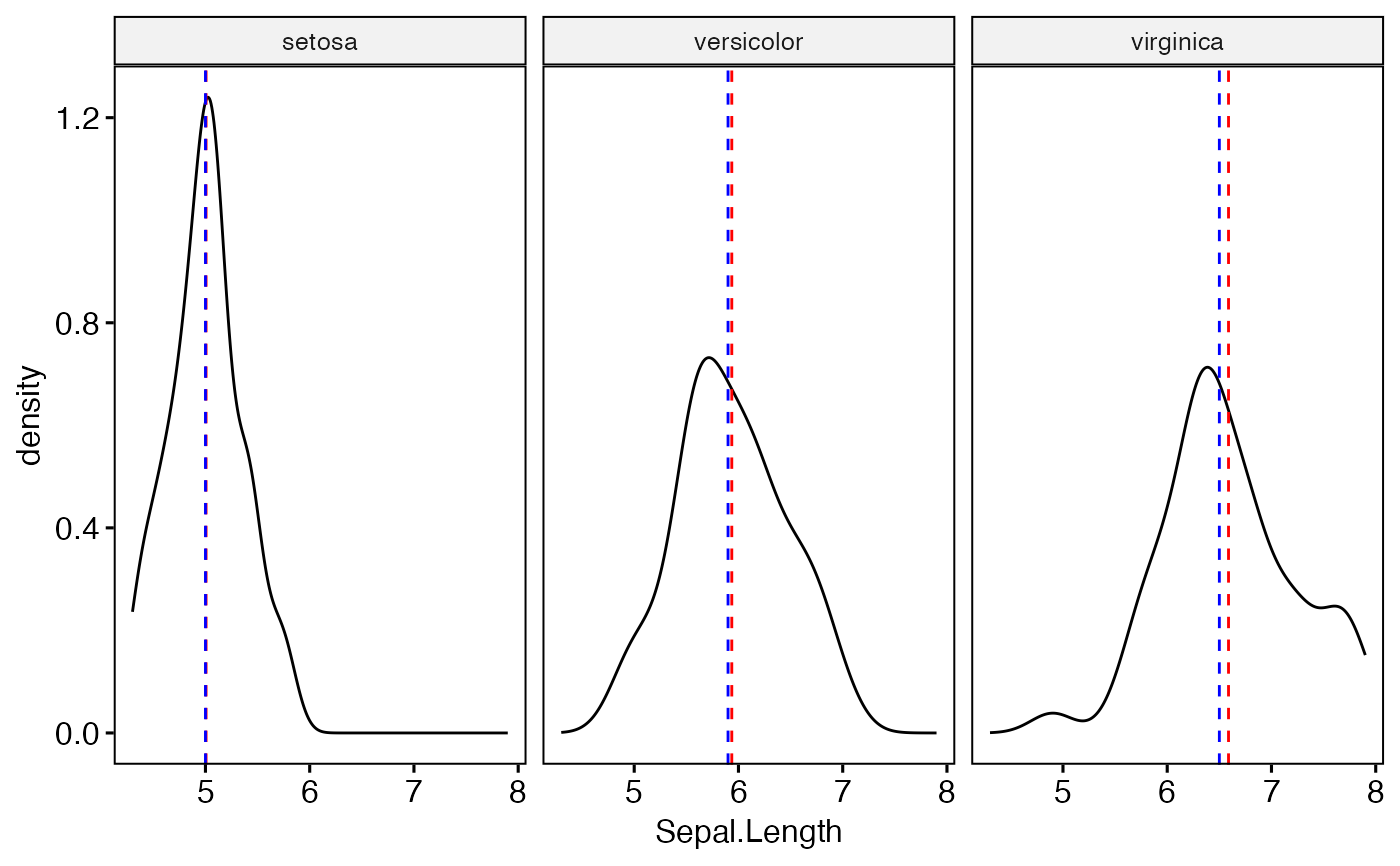
 # Facet
ggdensity(iris, "Sepal.Length", facet.by = "Species") +
stat_central_tendency(type = "mean", color = "red", linetype = 2) +
stat_central_tendency(type = "median", color = "blue", linetype = 2)
# Facet
ggdensity(iris, "Sepal.Length", facet.by = "Species") +
stat_central_tendency(type = "mean", color = "red", linetype = 2) +
stat_central_tendency(type = "median", color = "blue", linetype = 2)