Build a factoextra-ready object from pre-computed coordinates
Source:R/as_factoextra.R
as_factoextra.Rdas_factoextra_pca() wraps pre-computed individual (and, optionally,
variable) coordinates into an object that the fviz_pca family
(fviz_pca_ind(), fviz_pca_var(), fviz_pca_biplot()),
fviz_eig, fviz_contrib and fviz_cos2
can plot directly.
It lets you apply factoextra's visualizations to the output of any
dimension-reduction method - for example stats::cmdscale(),
ape::pcoa(), UMAP/t-SNE embeddings, vegan::rda()/cca(),
or a custom analysis - without having to write a dedicated backend. You bring
the coordinates; factoextra draws the biplot, scree plot, contributions and
cos2.
as_factoextra_pca(
  ind.coord,
  var.coord = NULL,
  eig = NULL,
  ind.cos2 = NULL,
  ind.contrib = NULL,
  var.cos2 = NULL,
  var.contrib = NULL,
  var.cor = NULL,
  scale.unit = FALSE
)
Arguments
- ind.coord
individual (observation) coordinates: a numeric matrix or data frame with one column per dimension (the "scores"). Required.
- var.coord
optional variable coordinates / loadings: a numeric matrix or data frame with one column per dimension. Supplying it enables
fviz_pca_var()andfviz_pca_biplot().- eig
optional numeric vector of eigenvalues (length \(\ge\) number of dimensions). Used by the scree plot and to label the axes with the percentage of explained variance. When
NULL(default) it is set to the variance of each coordinate column (the natural definition of a PCA eigenvalue).- ind.cos2, ind.contrib, var.cos2, var.contrib, var.cor
optional pre-computed quality (
cos2), contribution and (variable) correlation matrices, with the same dimensions as the corresponding coordinates. When omitted they are derived from the coordinates (see Details).- scale.unit
logical. If
TRUE, the variable coordinates are treated as correlations and the correlation circle is drawn byfviz_pca_var(). Default isFALSE.
Value
An object of class c("factoextra_pca", "list") holding the
standardized ind (and var) results and eigenvalues, ready for
the fviz_pca_*() functions.
Details
When cos2/contrib are not supplied they are computed from the
coordinates:
contrib = 100 * coord^2 / colSums(coord^2)- the exact contribution of each element to each dimension.cos2 = coord^2 / rowSums(coord^2)- the quality of representation within the supplied dimensions. This equals the true cos2 only when all components are provided; with a truncated set of dimensions it is the quality restricted to that sub-space. Passind.cos2/var.cos2explicitly if you have the exact values.
Examples
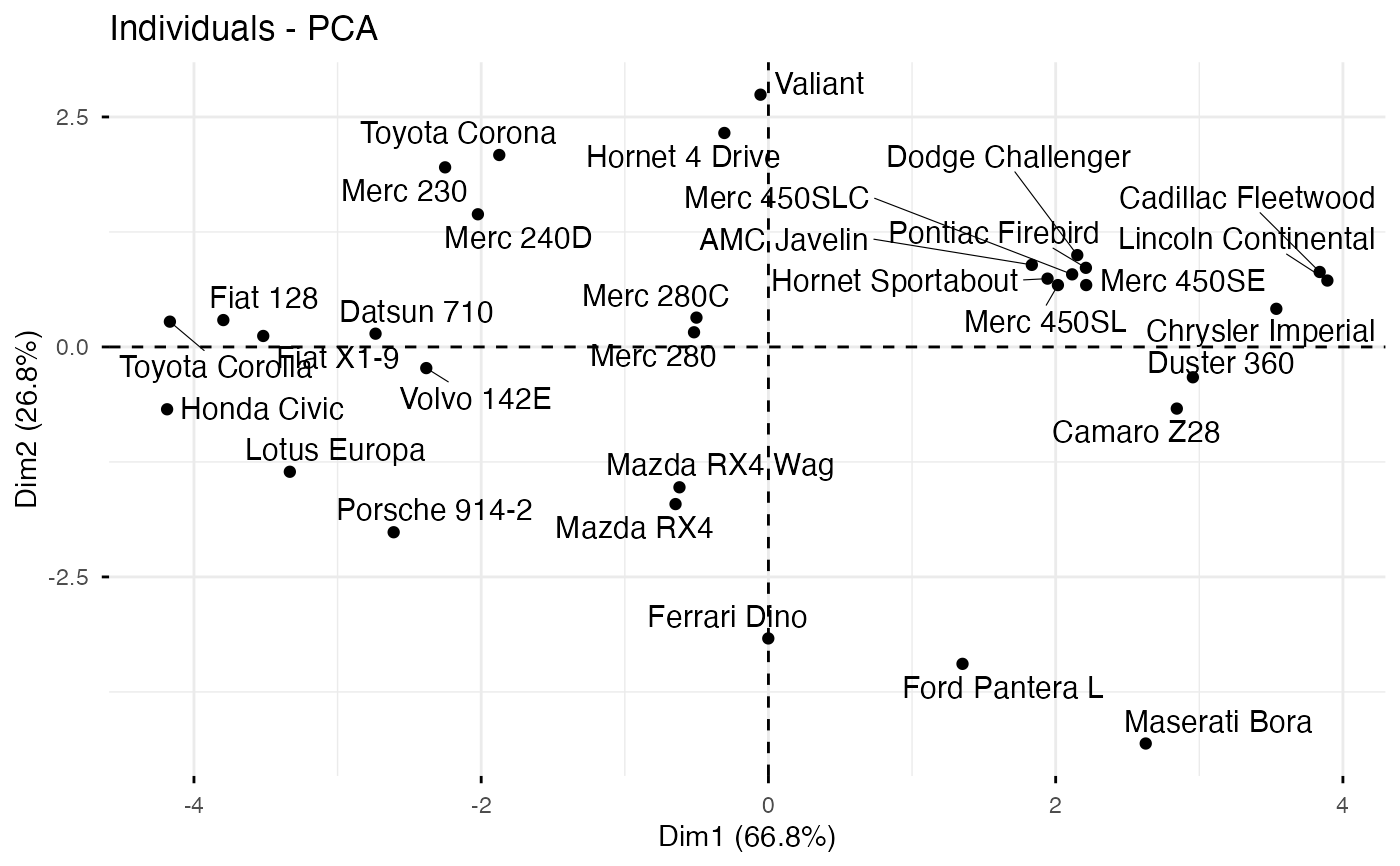
# 1. Bring your own coordinates: classical MDS (cmdscale) -> factoextra
d <- dist(scale(mtcars))
mds <- cmdscale(d, k = 3)
obj <- as_factoextra_pca(ind.coord = mds)
fviz_pca_ind(obj, repel = TRUE)
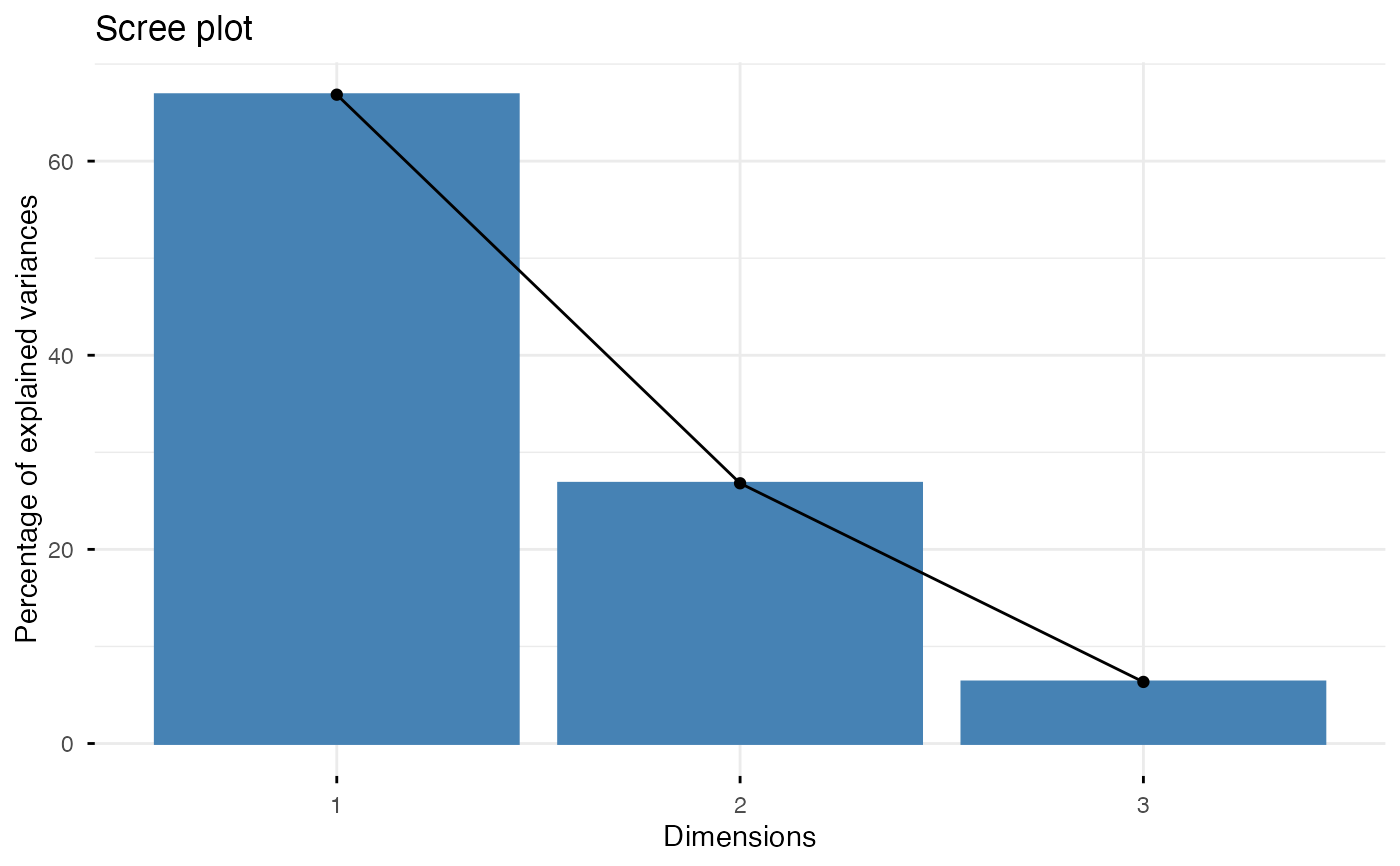
 fviz_eig(obj)
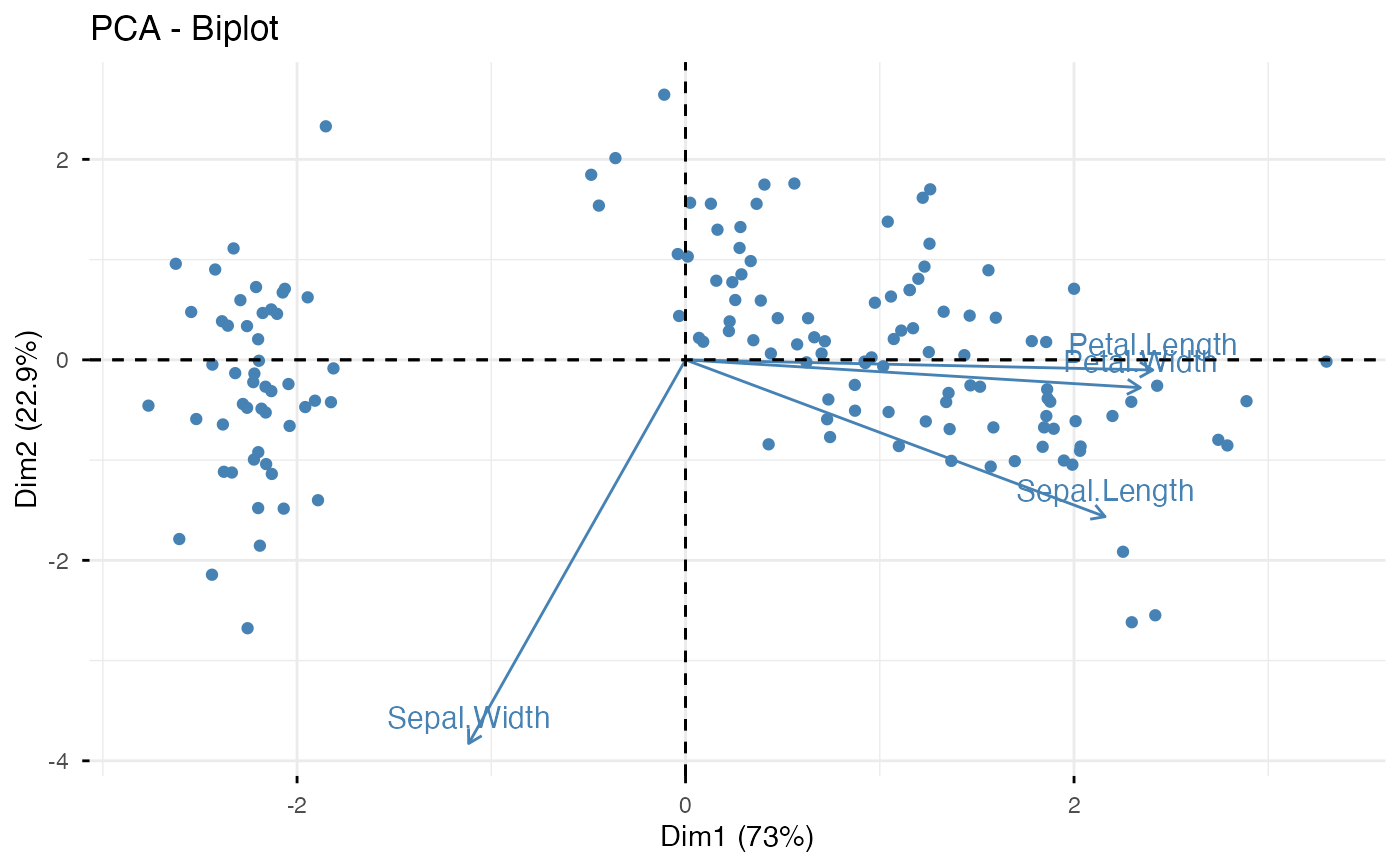
 # 2. Round-trip a prcomp result through the constructor (biplot)
pca <- prcomp(iris[, -5], scale. = TRUE)
obj2 <- as_factoextra_pca(
ind.coord = pca$x,
var.coord = pca$rotation,
eig = pca$sdev^2
)
fviz_pca_biplot(obj2, label = "var", col.ind = "steelblue")
# 2. Round-trip a prcomp result through the constructor (biplot)
pca <- prcomp(iris[, -5], scale. = TRUE)
obj2 <- as_factoextra_pca(
ind.coord = pca$x,
var.coord = pca$rotation,
eig = pca$sdev^2
)
fviz_pca_biplot(obj2, label = "var", col.ind = "steelblue")